
Dogecoin Price Today: DOGE Stuck Below $0.08 as Fear Index Hits 25

0
0
The cryptocurrency market is flashing warning signs as August 2026 begins. The Dogecoin price today sits near $0.07, with technical indicators revealing a market that has lost its bullish momentum even as volatility continues to compress.
Key takeaways
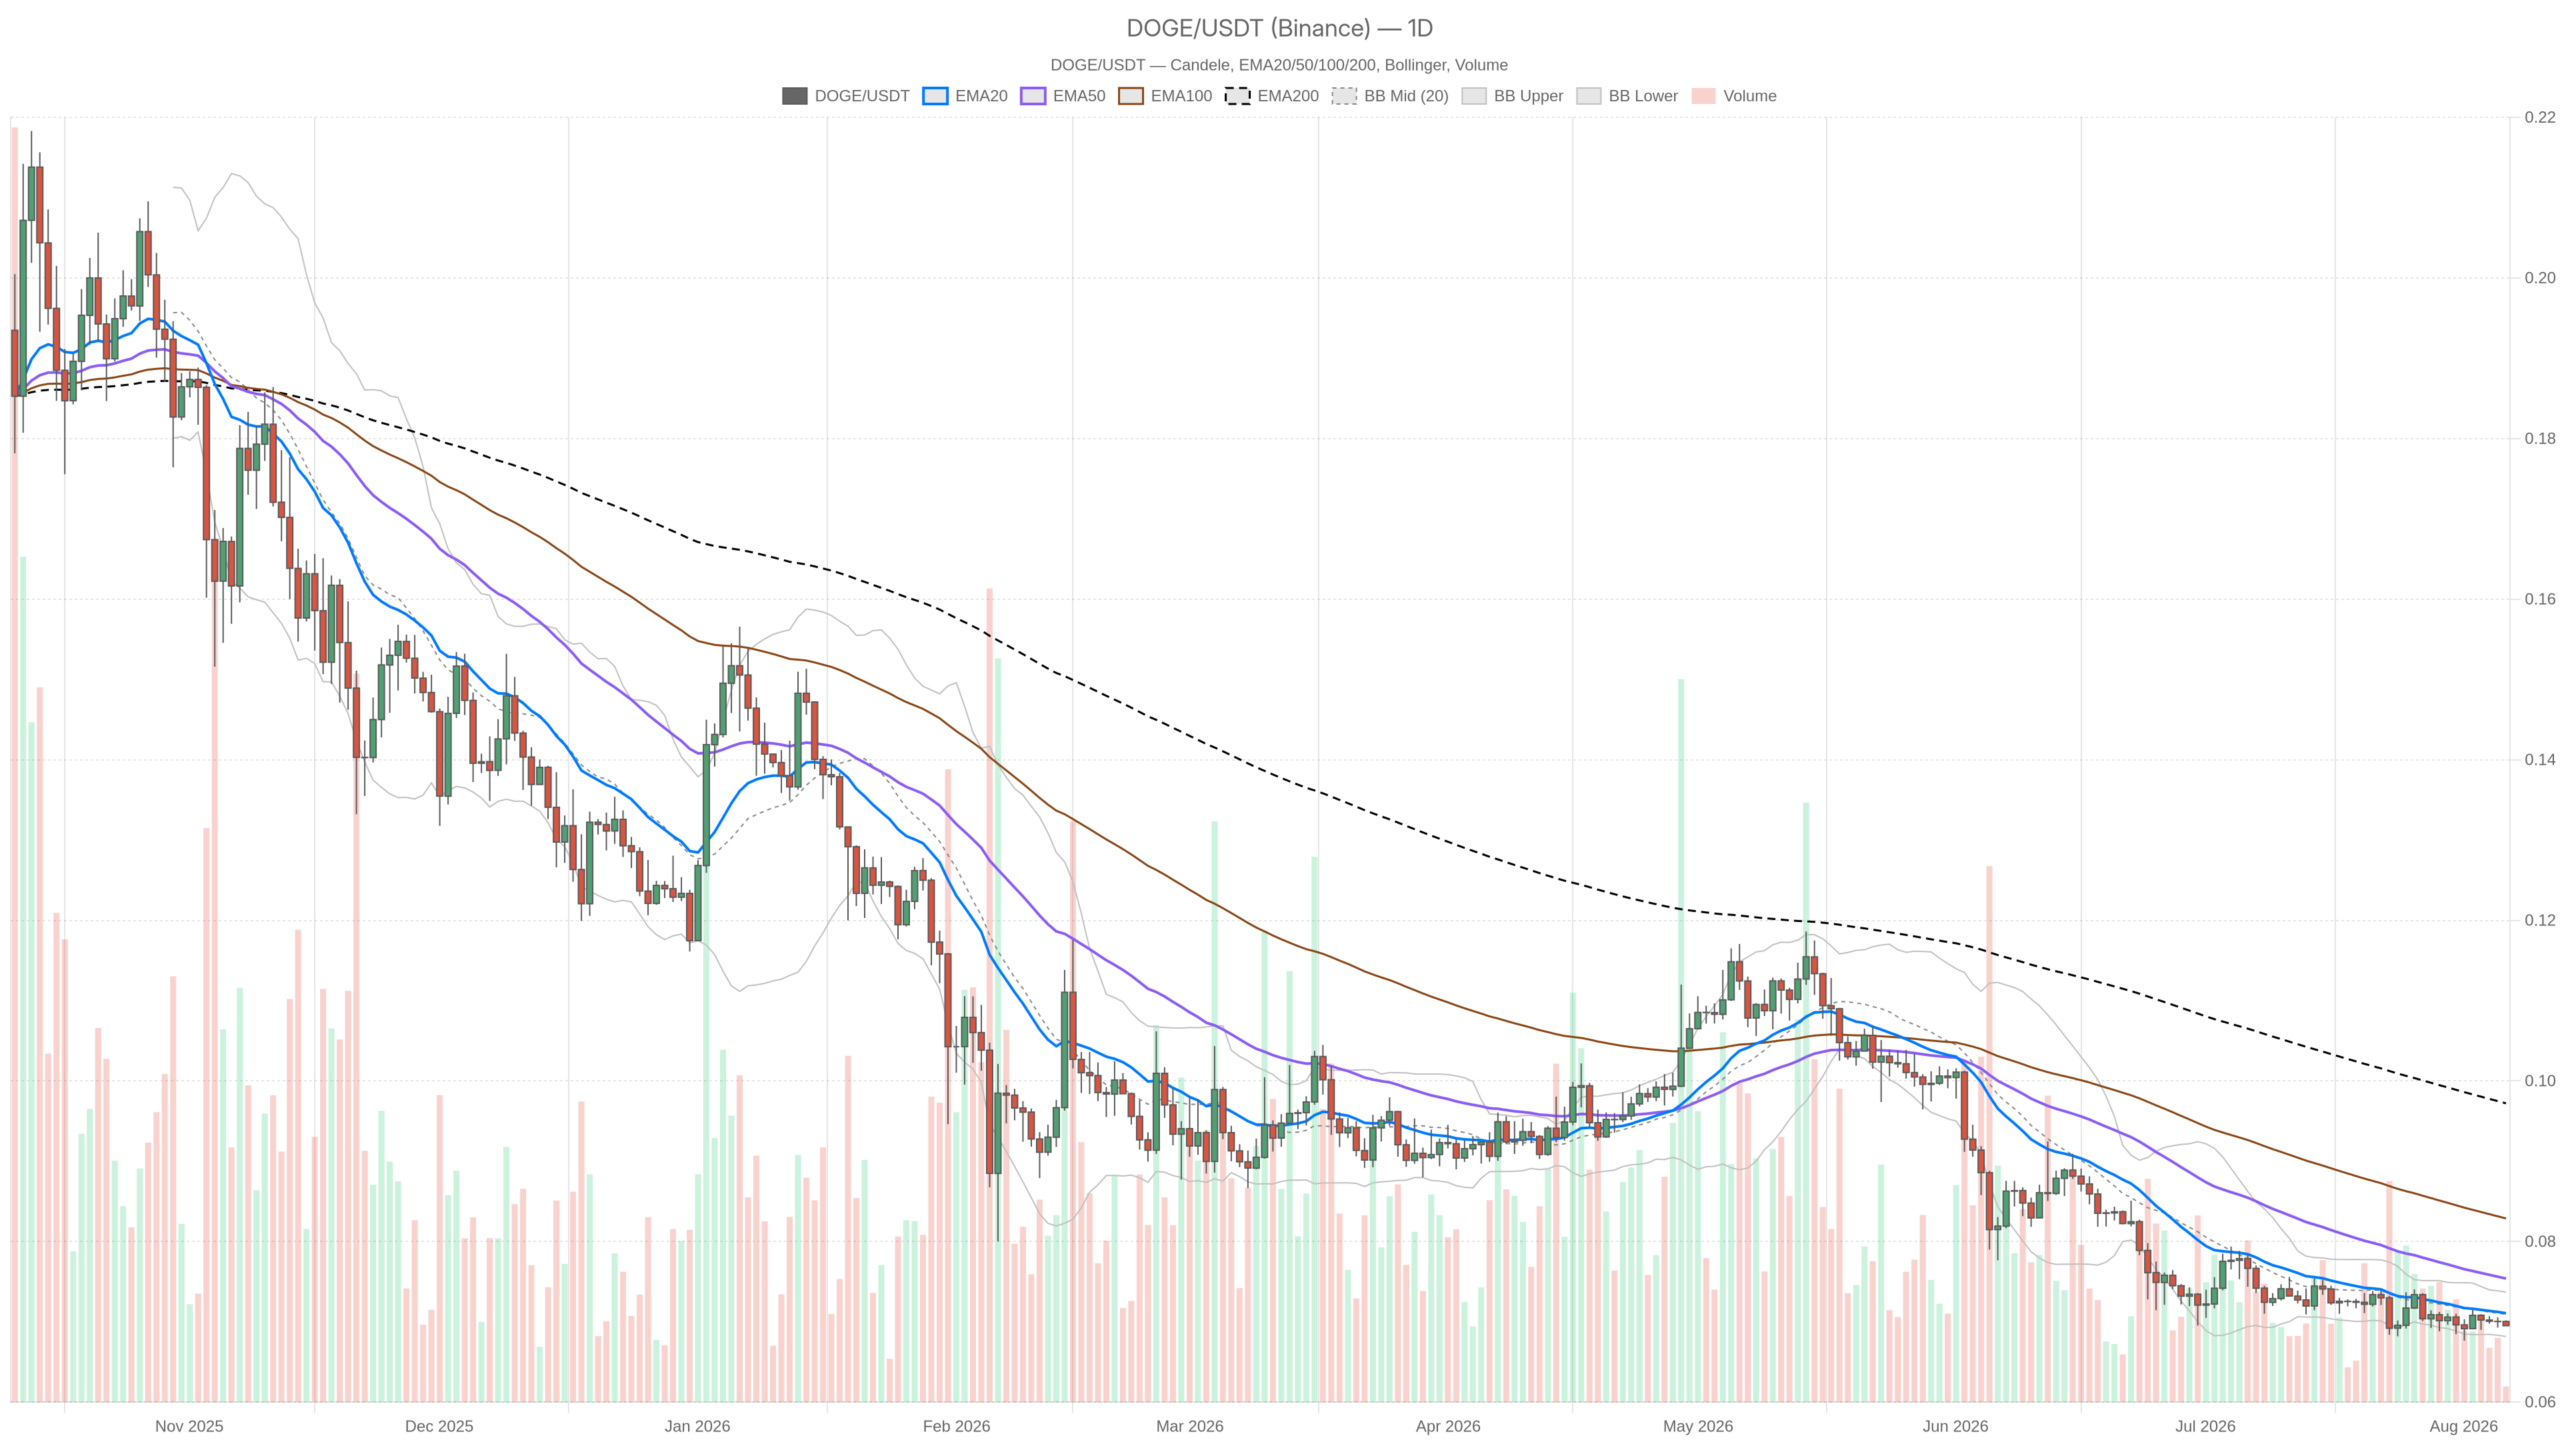
- DOGE trades around $0.07, below the EMA50 at $0.08 and the EMA200 at $0.10, confirming a bearish daily structure.
- The Fear & Greed Index reads 25 (“Extreme Fear”), while Bitcoin dominance holds at 56.71%, leaving altcoins with slim margins for error.
- RSI14 sits at 40.42 on the daily chart and MACD is flat at zero, signaling a momentum vacuum rather than an imminent reversal.
- Bollinger Bands are pinched across timeframes and ATR14 reads zero, pointing to a volatility squeeze that could resolve with a sharp directional move.
- Total crypto market capitalization stands at roughly $2.29 trillion, up 0.81% over 24 hours according to CoinGecko data.
Daily Chart: The Macro Bias Is Bearish, Not Neutral
On the daily timeframe, DOGE is trading at $0.07 against an EMA20 of $0.07, an EMA50 of $0.08, and an EMA200 of $0.10. That stacking is a textbook bearish structure: price below the medium-term average and well below the long-term one. It does not necessarily mean an imminent leg down. However, every rally into the $0.08 region runs into a moving average still sloping against the bulls.
Moreover, the $0.10 EMA200 remains a long way off, acting as a ceiling that underscores how far price must travel before the macro trend flips. RSI14 on the daily sits at 40.42 — soft, but not the kind of oversold reading that usually precedes a sharp reversal. It is the number you see in a grinding downtrend where sellers remain in control without panic-selling.
MACD is completely flat, with the line, signal, and histogram all reading zero. In practical terms, that is a momentum vacuum: no fresh bearish push, but also nothing to suggest buyers are stepping in with conviction. The daily regime classification itself is labeled bearish, and the indicator picture does not argue against that.
1H View: Confirmation, Not Contradiction
The 1-hour chart mirrors the daily almost exactly. Price, EMA20, EMA50, and EMA200 are all bunched together near $0.07, RSI14 reads 40.41, and MACD is once again flat at zero. When short-term moving averages converge this tightly, it usually reflects a market that has stopped trending and is instead compressing — waiting for a catalyst rather than producing one.
Bollinger Bands on both daily and 1H are essentially pinched together at $0.07 across the mid, upper, and lower bands, while ATR14 reads zero. That is about as clear a volatility-squeeze signal as you will get. The range has collapsed, and whichever direction it breaks is likely to move fast simply because there is so little friction left in the market.
Notably, the 1H does not contradict the daily bias here — it confirms the fatigue. If anything, the fact that momentum has flattened out on both timeframes at once suggests DOGE is not caught in an active bearish impulse. Rather, it is parked, waiting for the next catalyst to emerge.
15-Minute Context: No Edge for Execution
Zooming into the 15-minute chart, RSI14 drops to 37.48, the weakest reading across all three timeframes. Meanwhile, EMAs and MACD remain flat like everywhere else. Pivot levels on all timeframes — daily, 1H, and 15m — show the pivot point, R1, and S1 all clustered around $0.07.
However, that is not a typo in the data; it is a reflection of how tight this range has become. For anyone using the 15m for entries, there is currently no meaningful intraday structure to lean on. It is a range-bound tape until the broader compression resolves.
Bullish Scenario
For bulls, the path forward requires DOGE to reclaim the $0.07 EMA20 on the daily with enough follow-through to push through the $0.08 EMA50. That would start to repair the structure and open room toward the $0.10 EMA200. That level remains the real test: is this a genuine trend change, or just a bounce inside a larger downtrend?
A recovery in RSI back above the 50 mark on the daily, alongside MACD turning positive instead of sitting flat, would add weight to that case. What invalidates this scenario is simple. If price cannot clear the EMA50 and instead rolls over toward lower pivot support, the bullish attempt fails and the broader bearish regime stays intact.
Bearish Scenario
The bearish case is the path of least resistance right now. The daily regime is already classified as bearish, and price is trading beneath both the EMA50 and EMA200. A breakdown from this volatility squeeze to the downside would likely accelerate quickly, given how compressed the ATR has become.
Low volatility environments tend to produce sharp expansions once they break. Moreover, if the breakdown coincides with continued Extreme Fear readings in the broader market, selling pressure could intensify further. What would invalidate the bearish thesis is a decisive daily close above the EMA50, with RSI pushing past 50 and MACD flipping positive. Without that confirmation, sellers retain the benefit of the doubt.
Positioning and Risk
Right now, the Dogecoin price today reflects a market in a holding pattern rather than a clear directional trend. Flat momentum indicators, a squeezed volatility profile, and a daily structure favoring sellers over buyers all point to a standoff rather than a setup.
That said, the tension between quiet short-term charts and the firmly bearish daily bias demands caution rather than conviction. With Extreme Fear dominating sentiment and capital still leaning toward Bitcoin — dominance holds at 56.71% — Dogecoin is operating with less margin for error than usual.
Whichever way this volatility squeeze eventually breaks, it is worth remembering that compressed ranges like this one tend to resolve with speed, not warning. Anyone watching this setup should size their expectations, and their risk, accordingly.
FAQ
What is Dogecoin trading at right now?
As of August 6, 2026, DOGE is trading at approximately $0.07, sitting right on its EMA20 but below both the EMA50 at $0.08 and the EMA200 at $0.10.
Is Dogecoin in a bearish or bullish trend right now?
The daily chart shows a textbook bearish structure, with price trading below both medium-term and long-term moving averages. RSI14 at 40.42 and flat MACD readings confirm sellers remain in control, though without an active bearish impulse at this moment.
What does the current volatility squeeze mean for Dogecoin?
Bollinger Bands are pinched and ATR14 reads zero across multiple timeframes, indicating extremely low volatility. These compressed ranges typically resolve with sharp directional moves, meaning the next breakout could be fast regardless of which direction it takes.
Disclaimer: This article is for informational purposes only and does not constitute financial advice, an investment recommendation, or a solicitation to buy or sell any financial instrument or cryptocurrency. The analysis provided is not indicative of future results. Investing in crypto assets and financial markets carries a high risk of capital loss. Always do your own research (DYOR) and consult a qualified financial advisor before making any decision.
Article produced with the assistance of artificial intelligence and reviewed by the editorial team.
0
0


 Manage all your crypto, NFT and DeFi from one place
Securely connect the portfolio you’re using to start.

0
0

0
0

0
0
