
Chainlink Price Prediction : What Comes After This Trendline Shift?

0
0

Chainlink has been under pressure for months, but something has quietly changed on the daily chart, and this Chainlink price prediction looks at what it could mean going forward.
LINK spent a long stretch sliding lower under a well-defined trendline, and traders following the setup are now watching closely to see whether the recent shift in structure actually holds up.
The levels discussed below come from the 1-day LINKUSDT perpetual chart on Bybit via TradingView.
As this is a short-term daily setup, these levels should be rechecked if the price closes meaningfully beyond the stated range.
LINK Price Right Now
Metric | Value |
Current Price (CMP) | $8.798 |
24H Change | -0.78% |
Market Cap | $6.57B |
Futures Volume (24H) | $361.01M |
Spot Volume (24H) | $41.36M |
Open Interest | $573.63M |
Circulating Supply | 748.09M LINK |
Total Supply | 1.00B LINK |
Max Supply | 1.00B LINK |
Open interest is the total value of LINK futures contracts still open and not yet settled.
When open interest rises alongside price, it usually points to fresh capital entering the trend, while a drop in open interest during a rally can suggest the move is being driven more by short covering than by genuine new buying.
Chart source: TradingView, LINKUSDT Perpetual Contract, Bybit, 1 Day timeframe, captured August 14, 2026, at 11:14 AM IST (05:44 AM UTC).
Market data source: CoinGlass, Chainlink overview page, captured August 14, 2026.
Methodology and Data Sources
This Chainlink price outlook is built entirely from the daily chart structure supplied for today's session, combined with live market, liquidation, and holder data from CoinGlass.
No external analyst forecasts or added market commentary have been included.
Every support and resistance level below comes directly from the trendline breakout and the swing highs and lows marked on the chart.
LINK Price Performance Across Timeframes
Chainlink's short-term numbers look mixed against its longer-term trend.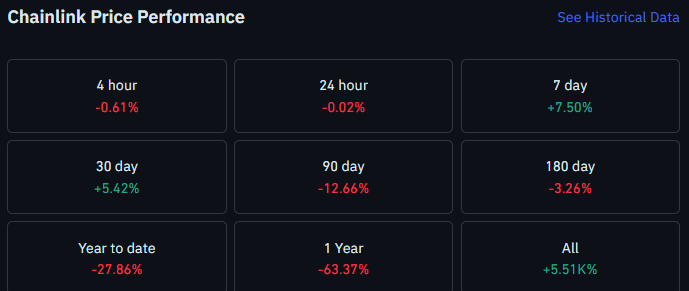
LINK is down 0.61% over 4 hours and roughly flat over 24 hours at -0.02%, but the 7-day change sits at a solid +7.50%.
The 30-day figure adds +5.42%, though the 90-day change of -12.66% and the year-to-date figure of -27.86% show the broader downtrend this recent bounce is trying to break out of. The 1-year change stands at -63.37%.
Source: CoinGlass, Chainlink Price Performance, August 14, 2026.
LINK ETF News: What the Spot ETF Flows Show
LINK ETF news has been a mixed bag over the past few sessions.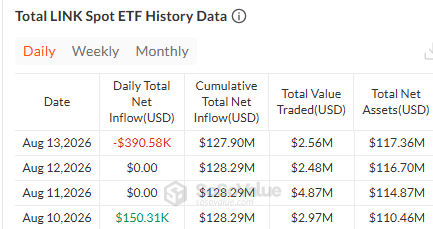
On August 13, 2026, the LINK spot ETF complex saw a daily net outflow of $390.58K, while the cumulative net inflow since launch held at $127.90M.
That followed two flat days on August 11 and 12 with zero net flow and a $150.31K inflow on August 10.
Total net assets have climbed steadily through the period, reaching $117.36M as of August 13.
Source: SoSoValue, Total LINK Spot ETF History Data, August 13, 2026.
LINK Holder Concentration: What On-Chain Data Shows
Chainlink's holder base remains fairly concentrated.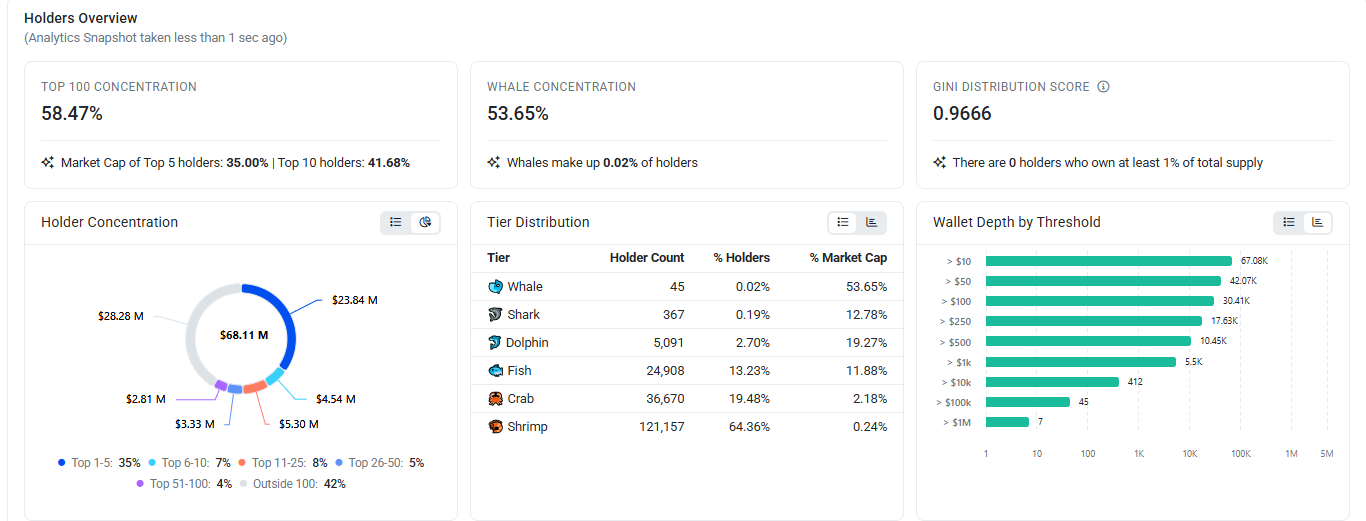
The top 100 addresses control 58.47% of supply, and whale wallets, just 0.02% of all holders, account for 53.65% of market cap.
The Gini distribution score sits at 0.9666, reflecting a skewed distribution, though notably no single holder currently owns 1% or more of total supply.
Smaller wallets dominate by count, with shrimp and crab tiers making up over 83% of holders but only a small slice of market cap.
Source: CoinGlass, Chainlink Holders Overview, August 14, 2026.
Liquidation Snapshot: Where Leverage Is Getting Squeezed
The liquidation picture for LINK has flipped compared to the longer stretch of long heavy squeezes seen earlier.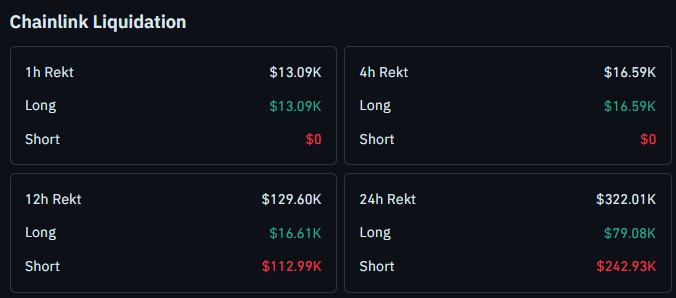
Over the last 24 hours, total liquidations came in at $322.01K, with short positions taking the bigger hit at $242.93K against $79.08K in longs.
The 12-hour window tells a similar story, with $112.99K in short liquidations versus $16.61K in longs.
On the shorter 1-hour and 4-hour windows, though, Longs briefly took the full hit at $13.09K and $16.59K, respectively, with zero short liquidations, showing how quickly the balance has been shifting intraday.
Source: CoinGlass, Chainlink Liquidation Data, August 14, 2026.
LINK Trend and Momentum: Key Takeaways
LINK broke above a long-standing daily descending trendline that had capped the price for months
Price is now finding support from a newer ascending trendline formed off recent higher lows
A close above 9.289 opens the path toward 10.873 and then 14.383
A close below 7.529 would flip the picture, with 7.167 as the next support to watch
Short side liquidations are dominating the last 24 hours, a shift from the long heavy pattern seen on other coins
Chainlink Price Prediction: Reading the Trendline Breakout
LINK spent months grinding lower under a daily descending trendline stretching back to February, a structure that repeatedly capped every recovery attempt along the way. 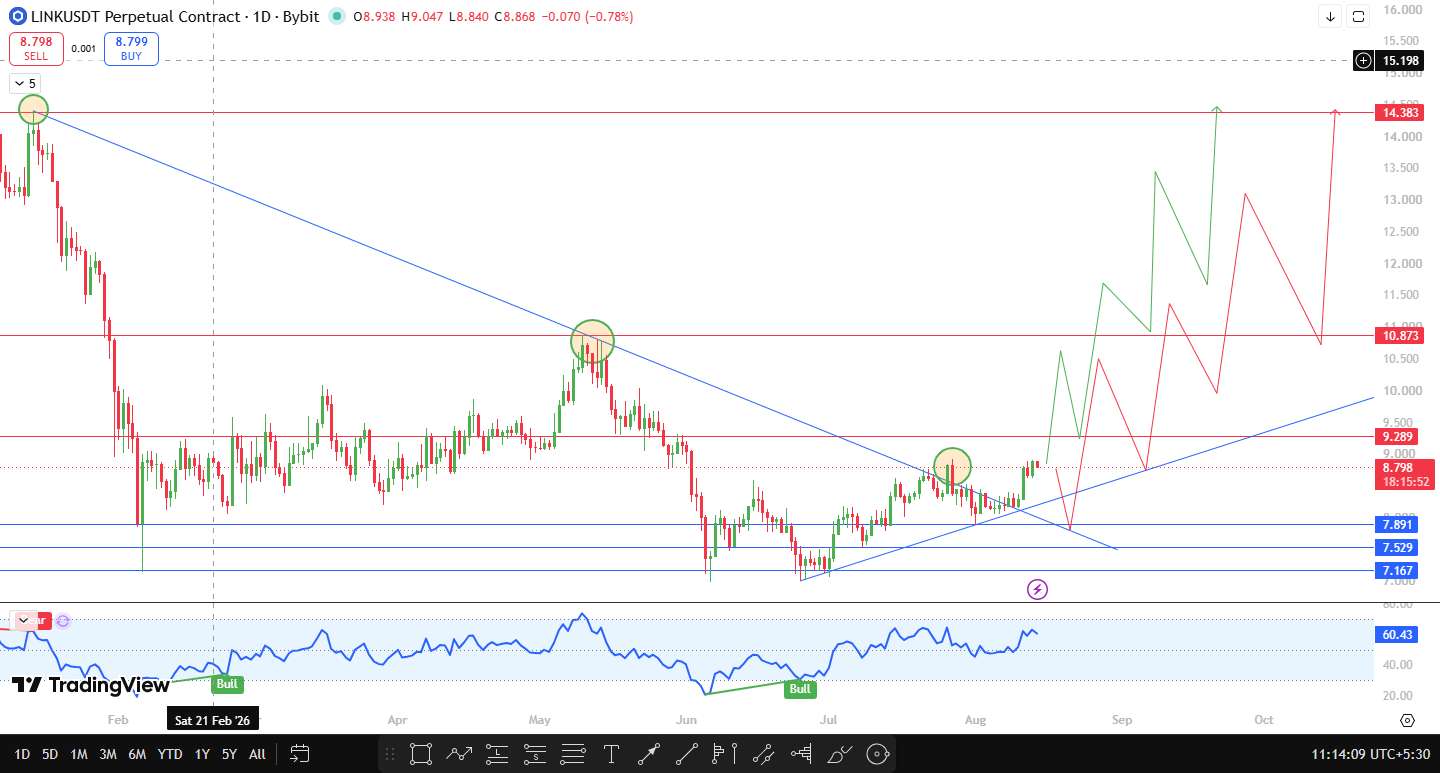
That trendline has now been broken, and price is holding above it while also finding support from a newer ascending trendline built off a series of higher lows since June.
The chart's built-in momentum oscillator is currently reading 60.43, sitting comfortably above the midline after flashing a bull outlook both in February and again more recently in August.
That kind of reading fits with a market that has shifted from a defensive downtrend into a more constructive phase, though it is still short of extreme overbought territory.
With both trendlines now working in LINK's favor, the setup leans toward continuation as long as the price holds above the ascending support.
A confirmed close above 9.289 would be the next real test, while losing the ascending trendline and closing below 7.529 would undo much of the recent structural improvement.
Technical Outlook Snapshot
Indicator | Signal |
Pattern | Descending trendline breakout, now supported by ascending trendline |
Momentum Oscillator | 60.43, above midline, bull tags in Feb and Aug |
Immediate Resistance | 9.289, breakout trigger level |
Immediate Support | 7.529, ascending trendline zone |
Bias | Constructive above ascending trendline support |
Support and Resistance Levels to Watch
Type | Level | Note | % From CMP |
Resistance 2 | $14.383 | Recent swing high | +63.49% |
Resistance 1 | $10.873 | Recent swing high | +23.59% |
Immediate Resistance | $9.289 | Breakout trigger level | +5.58% |
Immediate Support | $7.529 | Ascending trendline support | -14.42% |
Support 1 | $7.167 | Recent swing low | -18.54% |
Risk-Reward Table
Case | Trigger | Target |
Bullish | Close above $9.289 | $10.873, then $14.383 |
Bearish | Close below $7.529 | $7.167 |
A confirmed daily close above 9.289 with supporting volume would validate continuation toward the higher targets, while a daily close below 7.529 is the level that would invalidate the current ascending trendline structure.
Downside Risks to Keep in Mind
Trendline breakouts on daily charts can still fail, particularly if broader market conditions turn risk off.
Traders should watch for a close back below the ascending trendline as an early warning sign rather than reacting to intraday wicks alone.
Liquidity around the 9.289 and 10.873 zones can also attract stop-hunting activity given how much LINK has been contained by resistance in this range historically.
Anyone trading this setup with leverage should size positions with the recent liquidation swings in mind, since the balance between long and short liquidations has been shifting quickly session to session.
What Would Change This Chainlink Price Prediction?
This LINK technical outlook depends on price holding above the ascending trendline near 7.529.
A confirmed daily close beyond either 9.289 or 7.529 would be the trigger to revisit this Chainlink price forecast and adjust the targets.
Until one of those levels breaks, the current constructive bias stays in place.
How Bitcoin Sentiment Could Move LINK
Chainlink tends to move in step with broader crypto risk appetite, and Bitcoin often sets the tone for how altcoins like LINK behave around trendline tests.
A stable or bullish Bitcoin backdrop would support LINK's push toward 9.289, while a risk-off shift in Bitcoin sentiment could pressure the ascending trendline support and increase the odds of a slide toward 7.167.
When This Chainlink Price Prediction Gets Revisited
This setup will be revisited if LINK delivers a confirmed daily close above 9.289 or below 7.529, or if 48 hours pass without either level breaking, in which case the current range between the two trendlines will need to be reassessed.
Glossary
Descending Trendline: A downward-sloping line connecting a series of lower highs, often acting as resistance until price breaks above it.
Ascending Trendline: An upward-sloping line connecting a series of higher lows, often acting as dynamic support during an uptrend.
Open Interest: The total number of outstanding futures contracts that have not been settled, used as a gauge of capital flowing into or out of a market.
Liquidation: The forced closing of a leveraged position when losses exceed available margin, which can accelerate price moves in the direction of the liquidation.
Bull, Base, and Bear Case
Bull Case: LINK holds the ascending trendline support, closes above 9.289, and momentum carries price toward 10.873 with 14.383 as the extended target.
Base Case: LINK continues to consolidate between the ascending trendline support and 9.289 resistance while the market waits for a decisive close on either side.
Bear Case: LINK loses the ascending trendline, closes below 7.529, and slides back toward the 7.167 swing low, undoing the recent structural breakout.
Disclaimer
This article is for informational purposes only and should not be considered financial or investment advice. Cryptocurrency markets are highly volatile, and prices can change rapidly. CoinGabbar and the analyst do not hold a position in LINK at the time of publication. Readers should conduct their own research and consult a qualified financial advisor before making any investment decisions.
0
0

 Manage all your crypto, NFT and DeFi from one place
Securely connect the portfolio you’re using to start.

0
0

0
0

0
0

0
0