Bitcoin: Glassnode’s magic formula to time the market!
1M ago•

bullish:
1
bearish:
0
Share
The on-chain analysis platform Glassnode has just unveiled a set of innovative indicators that accurately locate the capitulation points and significant latent losses of Bitcoin investors. This new framework offers a better understanding of the supply-demand dynamics and helps identify potential market bottoms.

Bitcoin, a new framework to evaluate seller exhaustion
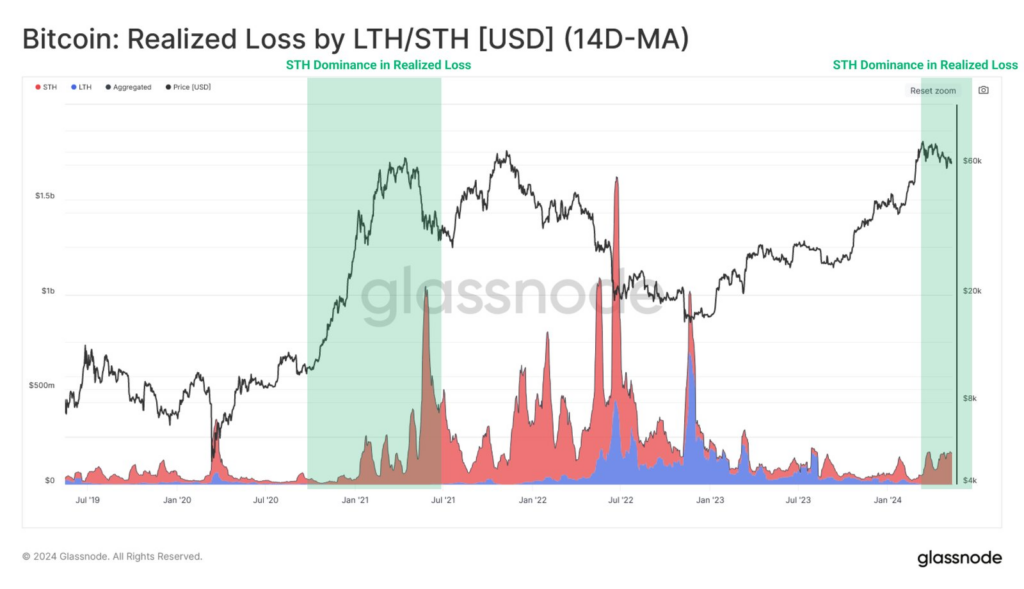
Bitcoin bull markets are marked by high volatility, punctuated by phases of correction. Glassnode observes that long-term holders (LTH) incur losses primarily during macro-cyclical slowdowns.
In contrast, short-term holders (STH) incur losses at all stages of the market cycle and represent the majority of losses in bull markets.
By specifically analyzing the STH cohort, which includes day traders and swing traders (weekly to monthly horizon), Glassnode seeks to identify capitulation periods of sellers. The objective is to detect inflection points during corrections within a dominant bull trend.
Seller capitulation is defined as an oversold point where most potential sellers have already sold. This coincides with an influx of demand from buyers, helping to form a local bottom. Inflection points tend to propagate from shorter to longer timeframes.
Three key indicators to evaluate investor pressure
Glassnode relies on three metrics to model the extreme financial pressure experienced by investors:
- The MVRV ratio (Market Value to Realized Value) which evaluates latent gains and losses.
- The SOPR ratio (Spent Output Profit Ratio) which measures the average magnitude of realized profits/losses.
- Realized losses in USD crystallized by the cohort.
For day traders, who are highly sensitive to price variations, the MVRV oscillates rapidly between high and low values. Glassnode focuses on moments when the MVRV Z-Score is below -1σ (sigma), revealing statistically significant selling pressure.
The SOPR confirms whether these losses have been realized by isolating Z-Scores below -1σ. Finally, realized losses in USD, with a Z-Score above +2σ, validate episodes of micro-capitulation.
Swing traders show a more gradual evolution of indicators, generating fewer signals but with a higher signal-to-noise ratio. The same methodology confirms the spread of selling pressure to longer horizons.
The transparency of on-chain data allows isolating the behavior of investor subsets based on their holding time. By combining three profitability indicators, Glassnode identifies micro-capitulation points accompanying local market bottoms. This framework helps decipher the incentives and actions of actors during phases of capitulation.
1M ago•
bullish:
1
bearish:
0
Share


 Manage all your crypto, NFT and DeFi from one place
Securely connect the portfolio you’re using to start.

bullish:
0
bearish:
0

bullish:
0
bearish:
0

bullish:
0
bearish:
0
