Polkadot price analysis: DOT/USD rises above $6.50 as buying pressure intensifies
0
0

The latest Polkadot price analysis shows that the digital asset has been rising steadily over the past few days, buoyed by a surge in buying pressure. The DOT/USD pair is currently trading at $6.55, up 1.33% on the day. The buyers continue to push prices higher and are aiming for new highs beyond the level of $6.61. This level of resistance was last seen in late January and could be tested if the buyers can maintain their momentum.

Looking at the overall market for all cryptocurrencies, it appears that most coins are trading in the green. BTC/USD is up 1.84%, AVAX/USD is up 1.6%, and XRP/USD is up 0.6%. This bullish sentiment could be providing support for DOT/USD, helping to drive the price higher.
Polkadot price analysis 1-day price chart: Bulls leading the charts
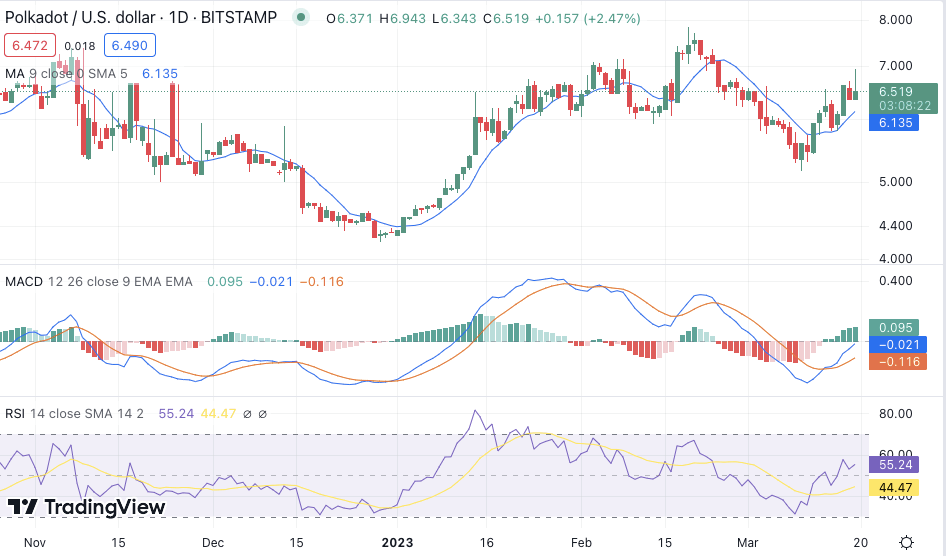
The 1-day price chart for Polkadot price analysis shows an increase in the cryptocurrency value as the DOT price floats at $6.55 at the time of writing. The bulls have successfully continued their lead. A sharp decline in the price value was observed earlier today, but during the second half of the session, buyers took command and pushed the price value higher.

The MACD indicator shows a buy signal as the MACD line remains above the signal line. The Relative Strength Index (RSI) is in an overbought region at 55.24 points. The Simple moving averages are currently in a bullish crossover, with the 50-day simple moving average (SMA) rising above the 200-day SMA. This indicates that the path of least resistance is to the upside and that the bulls are in control of the market. The RSI is currently at 55.24 and is rising, indicating that the Polkadot price is in bullish territory. However, it is approaching overbought levels, which could see the bulls take a break and allow the bears to take control of the market.
Polkadot price action on a 4-hour price chart: Recent developments
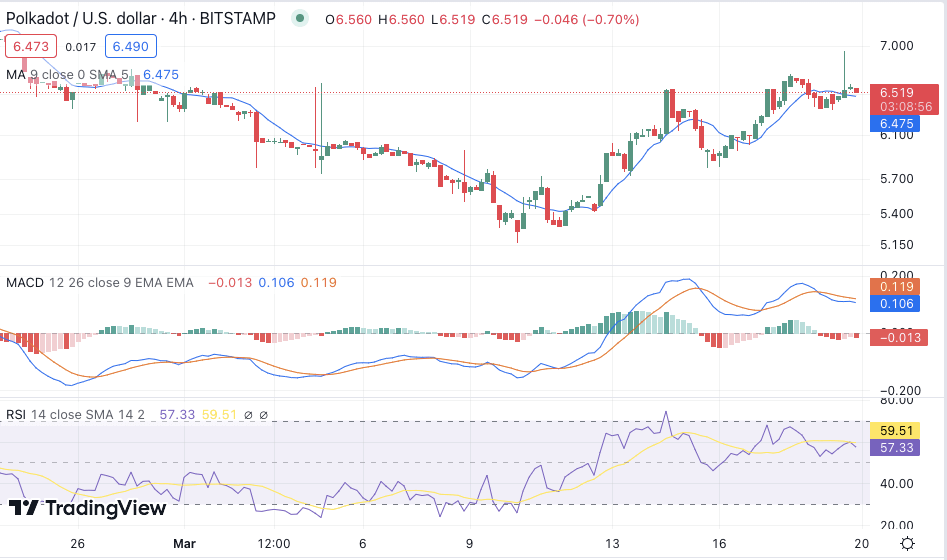
On the 4-hour Polkadot price analysis chart, we can see that Polkadot price analysis is currently in a bullish trend. The prices are trading along with the ascending channel, and a breakout from the current range could set the tone for the next move. On the 4-hour price chart, the buyers are currently in control as the prices are trading above the moving averages.

The MACD in line blue is above the signal line in red, indicating that the bulls have the momentum to push the prices higher. The RSI is currently moving in the overbought region, which indicates that the prices are due for a correction. The 50 SMA is currently providing support at $6.51, and 200-day SMA is currently facing resistance at $6.55.
Polkadot price analysis conclusion
Overall, Polkadot price is trading in a bullish trend. The buying pressure has intensified, and the bulls are aiming for a new high beyond the level of $6.61. The bulls have momentum, but the prices need to breach this level for a new high to be established. The technical indicators are currently indicating that the prices are in overbought territory, and a price correction could occur soon. The buyers need to maintain their momentum for DOT/USD to breach this level of resistance.
0
0
 Manage all your crypto, NFT and DeFi from one place
Securely connect the portfolio you’re using to start.


