Avalanche price analysis: AVAX drops 4 percent, another bearish run on the cards?
1y ago
bullish:
0
bearish:
0
Share

Avalanche price analysis shows price embarking on potentially another bearish run, after another dip of more than 4 percent took price to as low as $16.14. After being in decline for more than a month since mid-February, AVAX price picked up to $17.76 on March 14. Since then, following an extended sideways run, the token hit another downtrend today, taking price to as low as $16.21. While resistance remains set at the $18 mark, if the current downtrend intensifies, Avalanche price could be pushed down to the $15 mark.
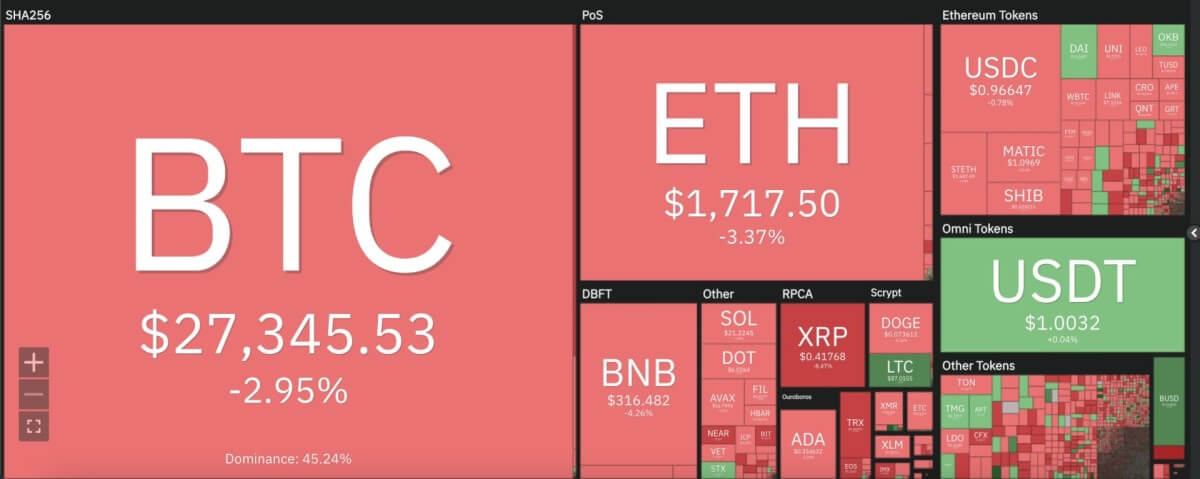
The larger cryptocurrency market underwent a similar fate as AVAX, as Bitcoin dropped 3 percent to $27,200, whereas Ethereum made a similar decline to move down to $1,700. Among leading Altcoins Ripple crashed 10 percent to lower down to $0.41, while Cardano dropped 2 percent at $2.29. Meanwhile, Dogecoin lost 3 percent to move down to $0.07, and Polkadot 4 percent to $6.04.

Avalanche price analysis: AVAX moves below moving averages on daily chart
On the 24-hour candlestick chart for Avalanche price analysis, price can be seen forming a set of bearish candlesticks indicating a sideways pattern around the $17 mark. The latest decline from today took price below the 9 and 21-day moving averages, along with the crucial 50-day exponential moving average (EMA) at $16.68. The 24-hour relative strength index (RSI) can be seen stagnating below the 50 mark and could be headed into the oversold region. Meanwhile, the moving average convergence divergence (MACD) curve shows some respite for the current AVAX trend, as the signal line can be seen just above the trend line currently.
Disclaimer. The information provided is not trading advice. Cryptopolitan.com holds no liability for any investments made based on the information provided on this page. We strongly recommend independent research and/or consultation with a qualified professional before making any investment decisions.
1y ago
bullish:
0
bearish:
0
Share

 Manage all your crypto, NFT and DeFi from one place
Securely connect the portfolio you’re using to start.

bullish:
0
bearish:
0

bullish:
0
bearish:
0

bullish:
0
bearish:
0

bullish:
0
bearish:
0