Ethereum price analysis: ETH corrects lower after a week of gains
1y ago
bullish:
2
bearish:
0
Share

Ethereum price analysis for today reveals that the bulls managed to push ETH’s price above the $1,770 resistance level. However, the buying pressure weakened and Ethereum quickly corrected lower and is currently trading near its short-term support at $1,690.52. The 10-day moving average has started to curl up as buyers attempt to reassert their dominance.
If buyers can push ETH’s price above the $1,770 resistance level in the near term, Ethereum could see some significant gains in the coming days. On the other hand, if sellers reclaim control, ETH could fall back to its support at $1,690.52.
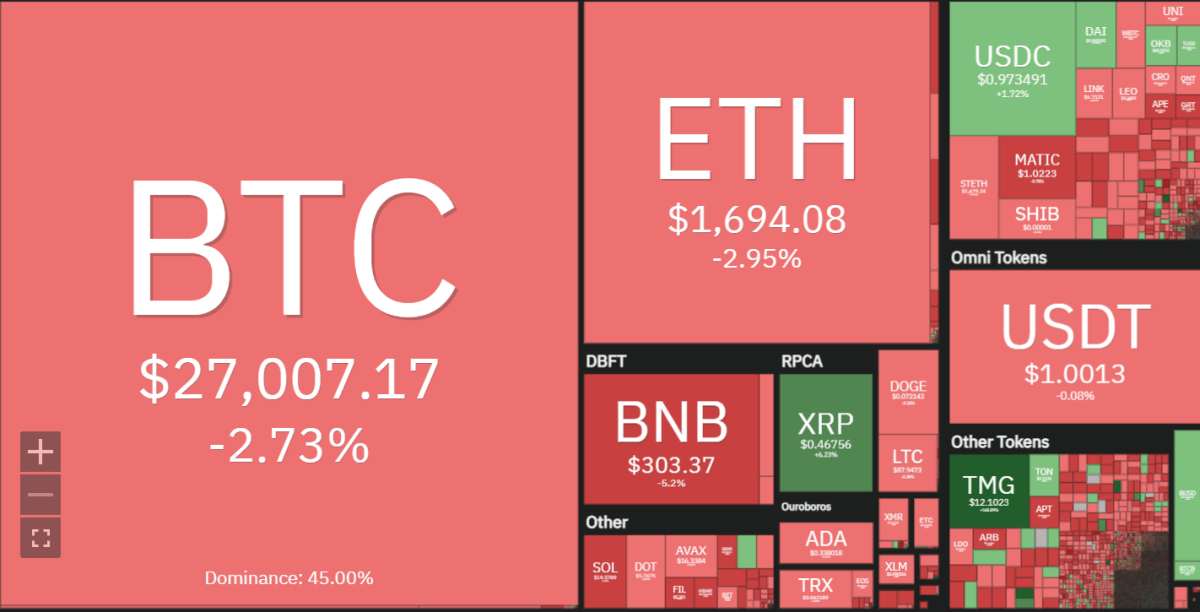
Ethereum price analysis reveals ETH is trading at $1,782.19, down by 3.33% in the last 24 hours. Ethereum’s trading volume is currently at $8.3 billion, while its market capitalization stands at $208.39 billion. Ethereum’s network’s latest news is that co-founder Vitalik Buterin initiated the first transaction as Polygon zkEVM Mainnet Beta goes live.
The next support level for Ethereum is at $1,690.52 and the next resistance level is at $1,770.
Analysts are watching to see if Ethereum will break out of its range and continue its upward trend or if it will fall back to its current levels.
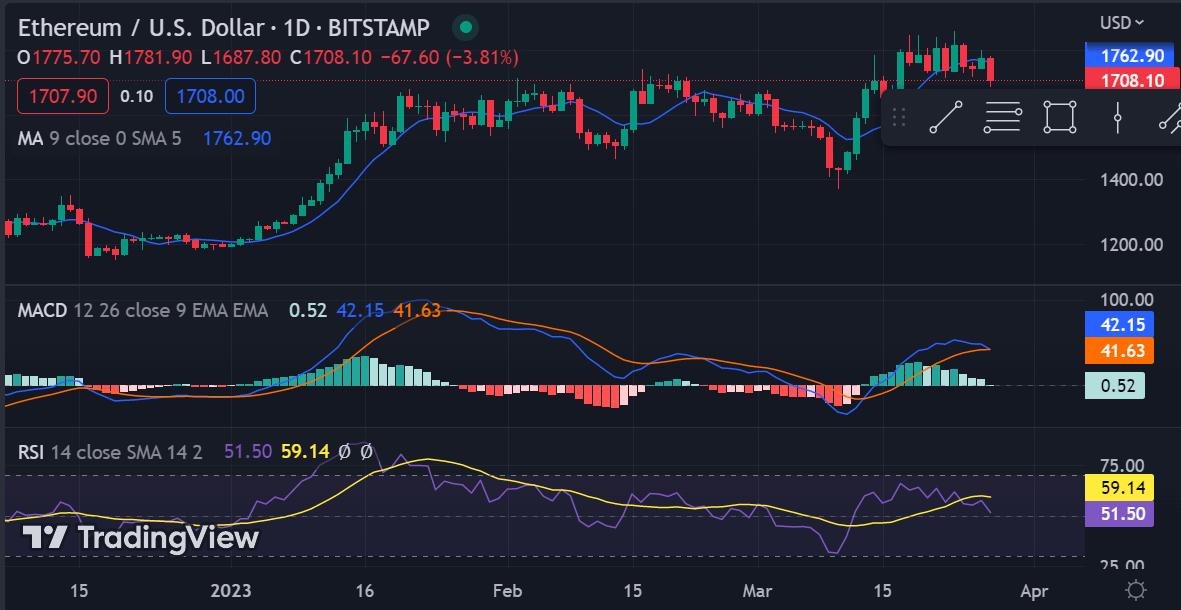
Ethereum price analysis on a daily chart: Bears capture the market
The daily chart for Ethereum price analysis reveals that Ethereum failed to sustain gains above the $1,770 level and quickly corrected lower. Currently, ETH is trading in a range between $1,690.52 and $1,782.19 as bulls attempt to break out of it.
If buyers can manage to push Ethereum’s price out of the range, Ethereum could see some significant gains in the near term. On the other hand, if sellers reclaim control and push ETH’s price below its support at $1,690.52, ETH could fall to lows of $1,650 in the near future.
For now, Ethereum is trading at $1,782.19, down by 3.33% in the last 24 hours. Ethereum’s trading volume is currently at $8.3 billion, while its market capitalization stands at $208.39 billion. Ethereum price analysis indicates that ETH’s next support level is at $1,690.52 and its next resistance level is at $1,770.
The technical indicators on the daily chart show the bulls are stumbling to defend the key support of $1,690.52. The Relative Strength Index (RSI) is hovering around the 40 level, which indicates that the market is bearish. The Moving Average Convergence Divergence (MACD) line is however above the red signal line, suggesting that the bulls might be able to defend their support and push Ethereum’s price higher.
Ethereum price analysis shows that Ethereum is trading bearishly in a range with the bulls attempting to break out of it. If buyers manage to push ETH’s price above the $1,770 resistance level, ETH could see some significant gains in the near term. However, if sellers reclaim control, Ethereum could fall back to its support at $1,690.52.
Ethereum price analysis on a 4-hour chart: ETH forms a bearish flag pattern
The 4-hour chart for Ethereum price analysis reveals that ETH has formed a bearish flag pattern, which suggests a possible sell-off in the near term. Currently, Ethereum is trading in between the 20 and 50-period moving averages as bulls attempt to break out of its range.
If buyers manage to push ETH’s price out of its range and above the $1,770 resistance level, Ethereum could see some significant gains in the near term. On the other hand, if sellers reclaim control, ETH could fall back to its support at $1,690.52.
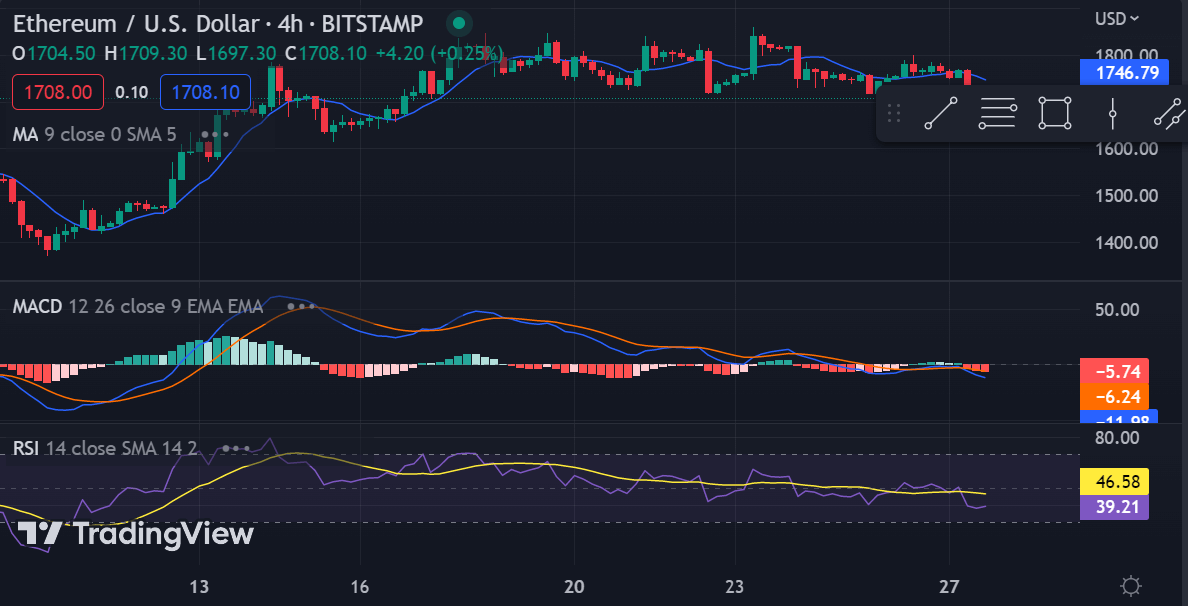
The technical indicators on the 4-hour chart suggest that the market is bearish. The MACD line is below the red signal line, while the RSI is hovering around the 30 levels.
Ethereum price analysis conclusion
Overall, Ethereum price analysis suggests that ETH is currently trading in a range between $1,690.52 and $1,782.19 as buyers attempt to assert their dominance over sellers. If buyers manage to push Ethereum’s price out of the range and above the $1,770 resistance level, ETH could see some significant gains in the near term. On the other hand, if sellers reclaim control, Ethereum could fall back to its support at $1,690.52.
1y ago
bullish:
2
bearish:
0
Share


 Manage all your crypto, NFT and DeFi from one place
Securely connect the portfolio you’re using to start.

bullish:
0
bearish:
0

bullish:
0
bearish:
0

bullish:
0
bearish:
0

bullish:
0
bearish:
0