BOBO Token Forms a Bearish Flag Pattern, Pointing to Potential Price Declines
1y ago•

bullish:
0
bearish:
0
Share

- Today’s BOBO token price analysis shows a decline of over 25%.
- The BOBO token price nosedived from a high of $0.00000001908 to a low of $0.000000006691.
- The formation of a bearish flag pattern indicates the continuation of the downward trend.
Bobo token price movement in the last 24 hours shows the altcoin has been trading in a horizontal trendline, with higher highs set at $0.00000001908. The bears staged a comeback and knocked the price to a low of $0.000000006691. Since then, BOBO prices have been falling continuously, with bears likely to be targeting the psychological level of $0.00000001138 in the short term.
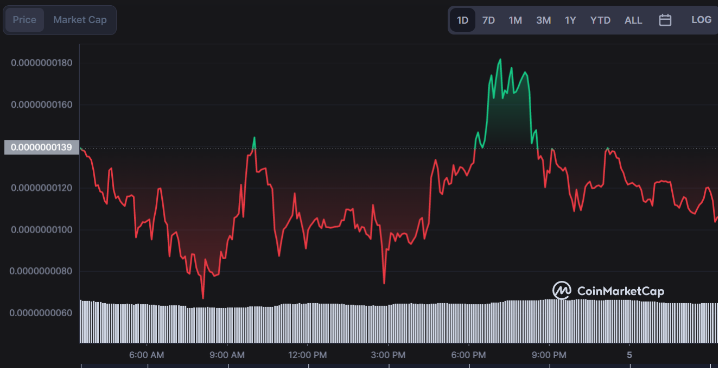
A technical perspective of the current price trend reveals the altcoin has sought support at the 21-day SMA and is forming a bearish flag pattern. The bears breached the previous key support of $0.00000001138 and are forming lower lows in the chart. If a bearish breakout of the flag is confirmed, we can expect further price declines for the BOBO token.
BOBO/USD Analysis on a 4-Hour Chart: Bears Mount Pressure
Bobo token price analysis on the 4-hour chart shows a price change of 26%, with the BOBO token seeking support at a low of $0.00000000871. The Fibonacci retracement level of 23.6% at $0.00000001138 has become a crucial level for the bulls, with further price dips likely to come soon if this support is breached.
The Relative Strength Index (RSI) stands at 38, indicating the bears have the upper hand and are likely to push prices lower. Additionally, the Moving Average Convergence Divergence (MACD) line is below the signal line, and the histogram size has increased, indicating a bearish trend in the BOBO token market.
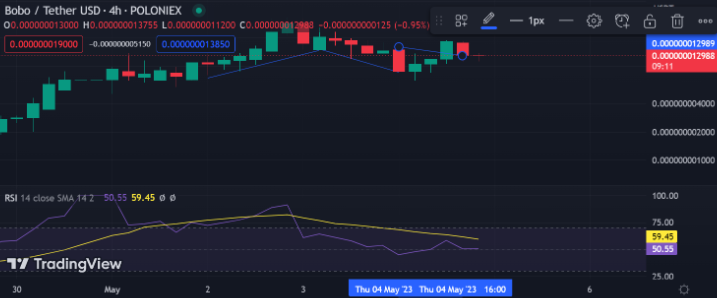
The Average Directional Index (ADX) stands at 34, which suggests that the trend is still strong. If this holds, the bears will continue to dominate in the coming days and drop prices. The stochastic RSI indicator is below the oversold level and is currently at 12. If it shows an upward move, the bulls could gain some traction and push prices higher.
A bearish flag pattern is being formed in the BOBO token market, and this could lead to a further downside correction. The bears are likely to be targeting a level of $0.00000001138, which has been acting as a strong support for the altcoin. On the upside, the bulls need to break above the recent high of $0.00000001908 and reclaim this level, for an uptrend to be established.
1y ago•
bullish:
0
bearish:
0
Share
 Manage all your crypto, NFT and DeFi from one place
Securely connect the portfolio you’re using to start.

bullish:
0
bearish:
0

bullish:
0
bearish:
0

bullish:
0
bearish:
0

bullish:
0
bearish:
0