Bitcoin Rainbow Charts: How Do They Work
Bitcoin was launched in 2009 due to the distrust in the traditional financial system and the centralized control of money. While most cryptocurrency enthusiasts believe it could one day replace physical cash, Bitcoin’s key characteristic is its volatility. Bitcoin is well-known for its price fluctuations and high daily volatility and has highly increased in value since it came to the crypto market in 2009.
Since then, investors have been looking for ways to understand Bitcoin’s volatility and use this information as an indicator of its future prices. While it’s practically impossible to rely on a scientifically proven method for buying or selling Bitcoin, there are several ways to understand its volatility better and make well-informed investing decisions. One popular approach is using a crypto trading bot to automate trades based on market trends and technical indicators.
The Bitcoin Rainbow Chart has proven to be one such method for effectively measuring market changes, data, volatility, and long-term price movements to help you make trading decisions. In this article, we’ll tell you what Bitcoin Rainbow Charts are and how to use them to your advantage.
What Is a Bitcoin Rainbow Chart?

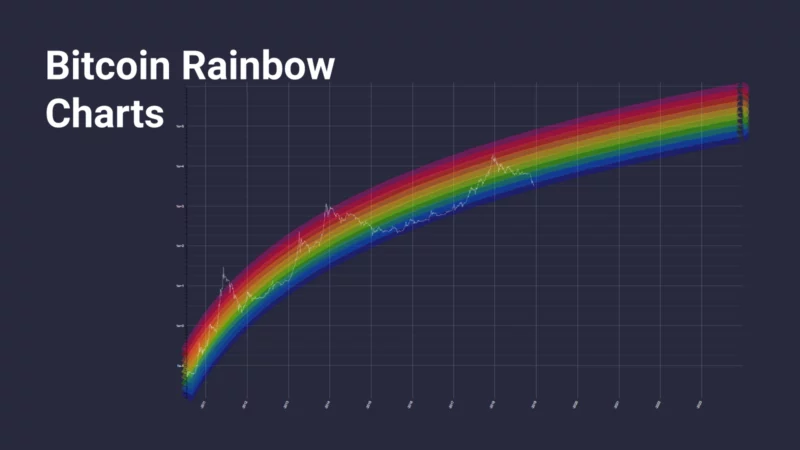
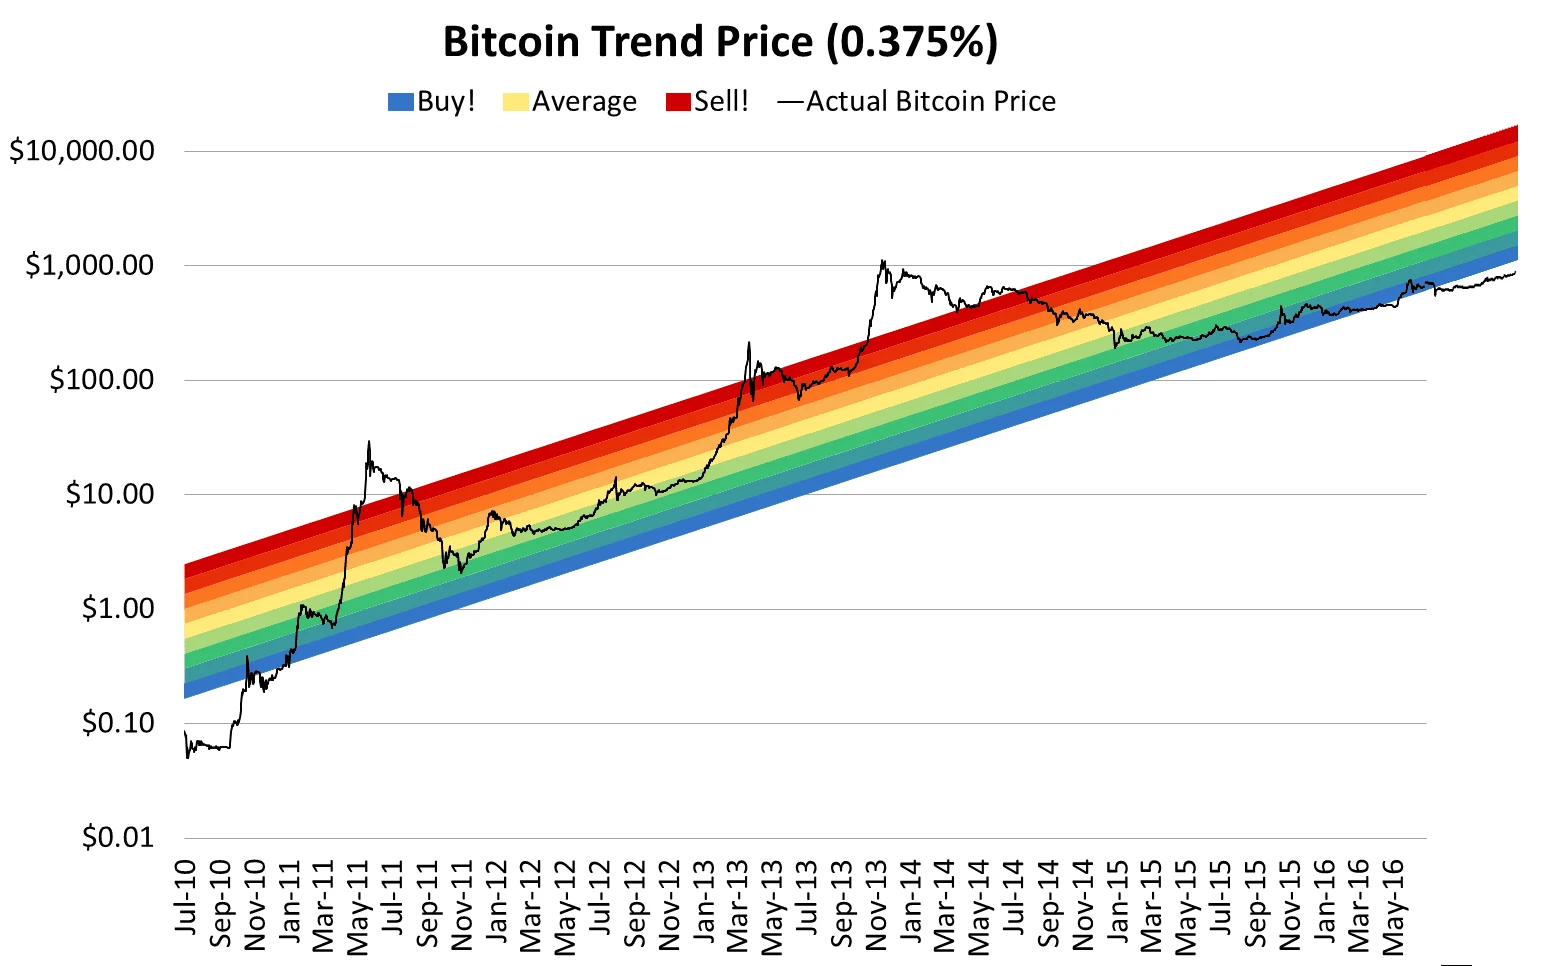
The Bitcoin Rainbow Chart is a basic logarithmic regression chart representing the Bitcoin price evolution over time. The Bitcoin Rainbow Chart consists of coloured bands to indicate when it may be time to buy, sell, or hold Bitcoin. The rainbow’s lower bound color is blue, indicating a drop in Bitcoin price, while the red color is its upper bound, meaning an increase in its pricing.
The Rainbow Chart is a long-term valuation tool for Bitcoin that provides a viewpoint on investor strategy to buy or sell Bitcoin based on the highlighted market sentiment at each rainbow color stage.
The Rainbow Chart’s upper colours indicate a bullish market and an excellent time for strategic investors to sell Bitcoin. On the other hand, the lower colors show that the overall market sentiment is down, so it’s a great time to acquire more Bitcoin.
Bitcoin Rainbow Chart History
The first component of the Bitcoin Rainbow Chart was created in 2014 by Reddit user “azop” and posted online. It was designed in a fun way to show the BTC price trend over the years. The chart was so colourful and surprisingly accurate that it was named the Bitcoin Rainbow Chart.
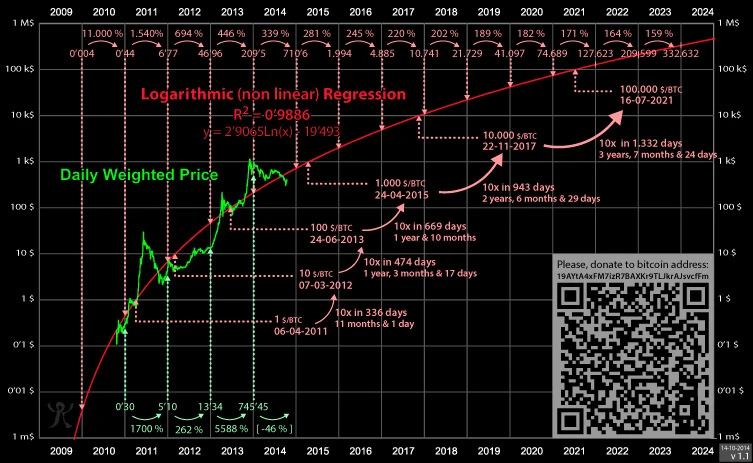
In the same year, a logarithmic regression model was introduced by a Bitcoin Talk user, trolololo. It was a statistical model indicating that most cryptocurrencies decreased or increased rapidly at the beginning before slowing down over time. This logarithmic regression was added to the BTC logarithmic chart, giving the Bitcoin Rainbow Chart a curve. First, the curve rose sharply before beginning to level out eventually.
How to Interpret Bitcoin Rainbow Chart?
While the Bitcoin Rainbow Chart can’t be predictive, it has largely been correct throughout the history of BTC.
The Rainbow price chart comprises nine separate color bands, such as:
- Blue: BTC is in a fire sale
- Bluish-Green: Buy zone
- Green: Cheap accumulate buy zone
- Light Green: Still cheap
- Yellow: Hold BTC
- Light Orange: Is this a bubble?
- Dark Orange: FOMO intensifies
- Red: Sell BTC
- Dark Red: Maximum bubble territory.
How Accurate Is the BTC Rainbow Chart?
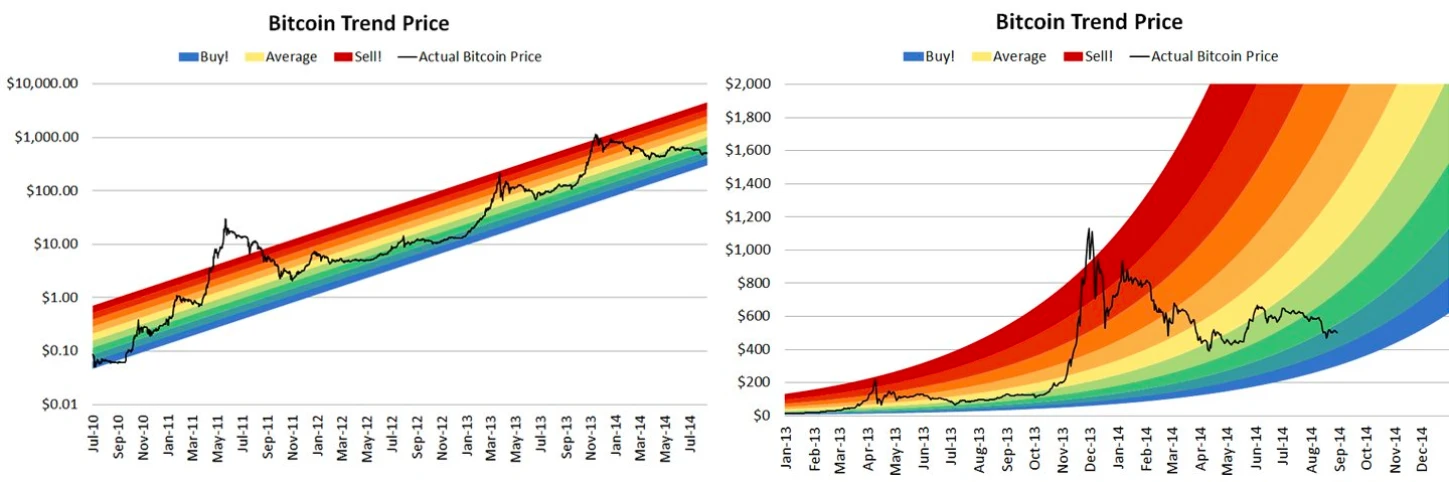
While the BTC Rainbow Chart is based on the most recent data and provides comparability of adoption rate, speed, and stable price in the future, the regression lines are usually drawn on high timeframes. So, they don’t need to be adjusted often and can’t be used for short-term predictions. The lines in a logarithmic regression chart are drawn based on the lower and upper prices of the markets, but if the price is trading in the middle of these bounds, it becomes very unreliable.
However, the Rainbow Chart has many features to predict future results for the BTC price. Past Bitcoin price movements indicate that every time there was a Bitcoin halving, the price would be adjusted higher to the Dark Red band. The recent Bitcoin halving was on May 11, 2022, and the price moved to the Dark Orange color band, meaning FOMO and time to sell. As the next Bitcoin halving is expected to happen in the middle of 2024, it’s essential to keep track of future predictions and use this data to enter or exit a trade accordingly.
Tip: Bitcoin halving means that the rate of new Bitcoin entering the market is reduced, which slows down the inflation of Bitcoin itself.
Additionally, the rainbow Chart is applicable to other cryptocurrencies, i.e., an Ethereum Rainbow Chart can be used for insights into the Ethereum price by ETH investors.
Conclusion
The Rainbow chart could be an excellent tool for users if combined with other crypto trading indicators, such as the Fear and Greed Index, RSI (relative strength index), etc. You can use the logarithmic regression curves to find Bitcoin’s “Fair value,” i.e., the natural regression of the price of an asset, stock, or crypto coin.
However, while color bands follow a logarithmic regression, they are otherwise basically arbitrary and without any scientific basis.
Investment Advice Disclaimer: The information contained on this site is provided to you solely for informational purposes and does not constitute a recommendation by CoinStats to buy, sell, or hold any securities, financial product, or instrument mentioned in the content, nor does it constitute investment advice, financial advice, trading advice, or any other type of advice. Our information is based on independent research and may differ from what you see from a financial institution or service provider.
Investments are subject to market risk, including the possible loss of principal. Cryptocurrency is a highly volatile market sensitive to secondary activity, do your independent research, obtain your own advice, and only invest what you can afford to lose. There are significant risks involved in trading CFDs, stocks, and cryptocurrencies. Between 74-89% of retail investor accounts lose money when trading CFDs. Past performance is not an indication of future results.