Ethereum, Cosmos, Nano Price Analysis: 28 December
3y ago
bullish:
5
bearish:
1
Share

Ethereum noted a solidly bullish outlook on both its short and long-term charts and might target $800, if it climbs past $750. Cosmos registered increasing buying volume behind its ascent past the $4.8-level, but it remains to be seen if the market's bulls can drive the prices higher to overwhelm the bears' longer-term strength. Finally, Nano climbed above its $1-level of support.
Ethereum [ETH]
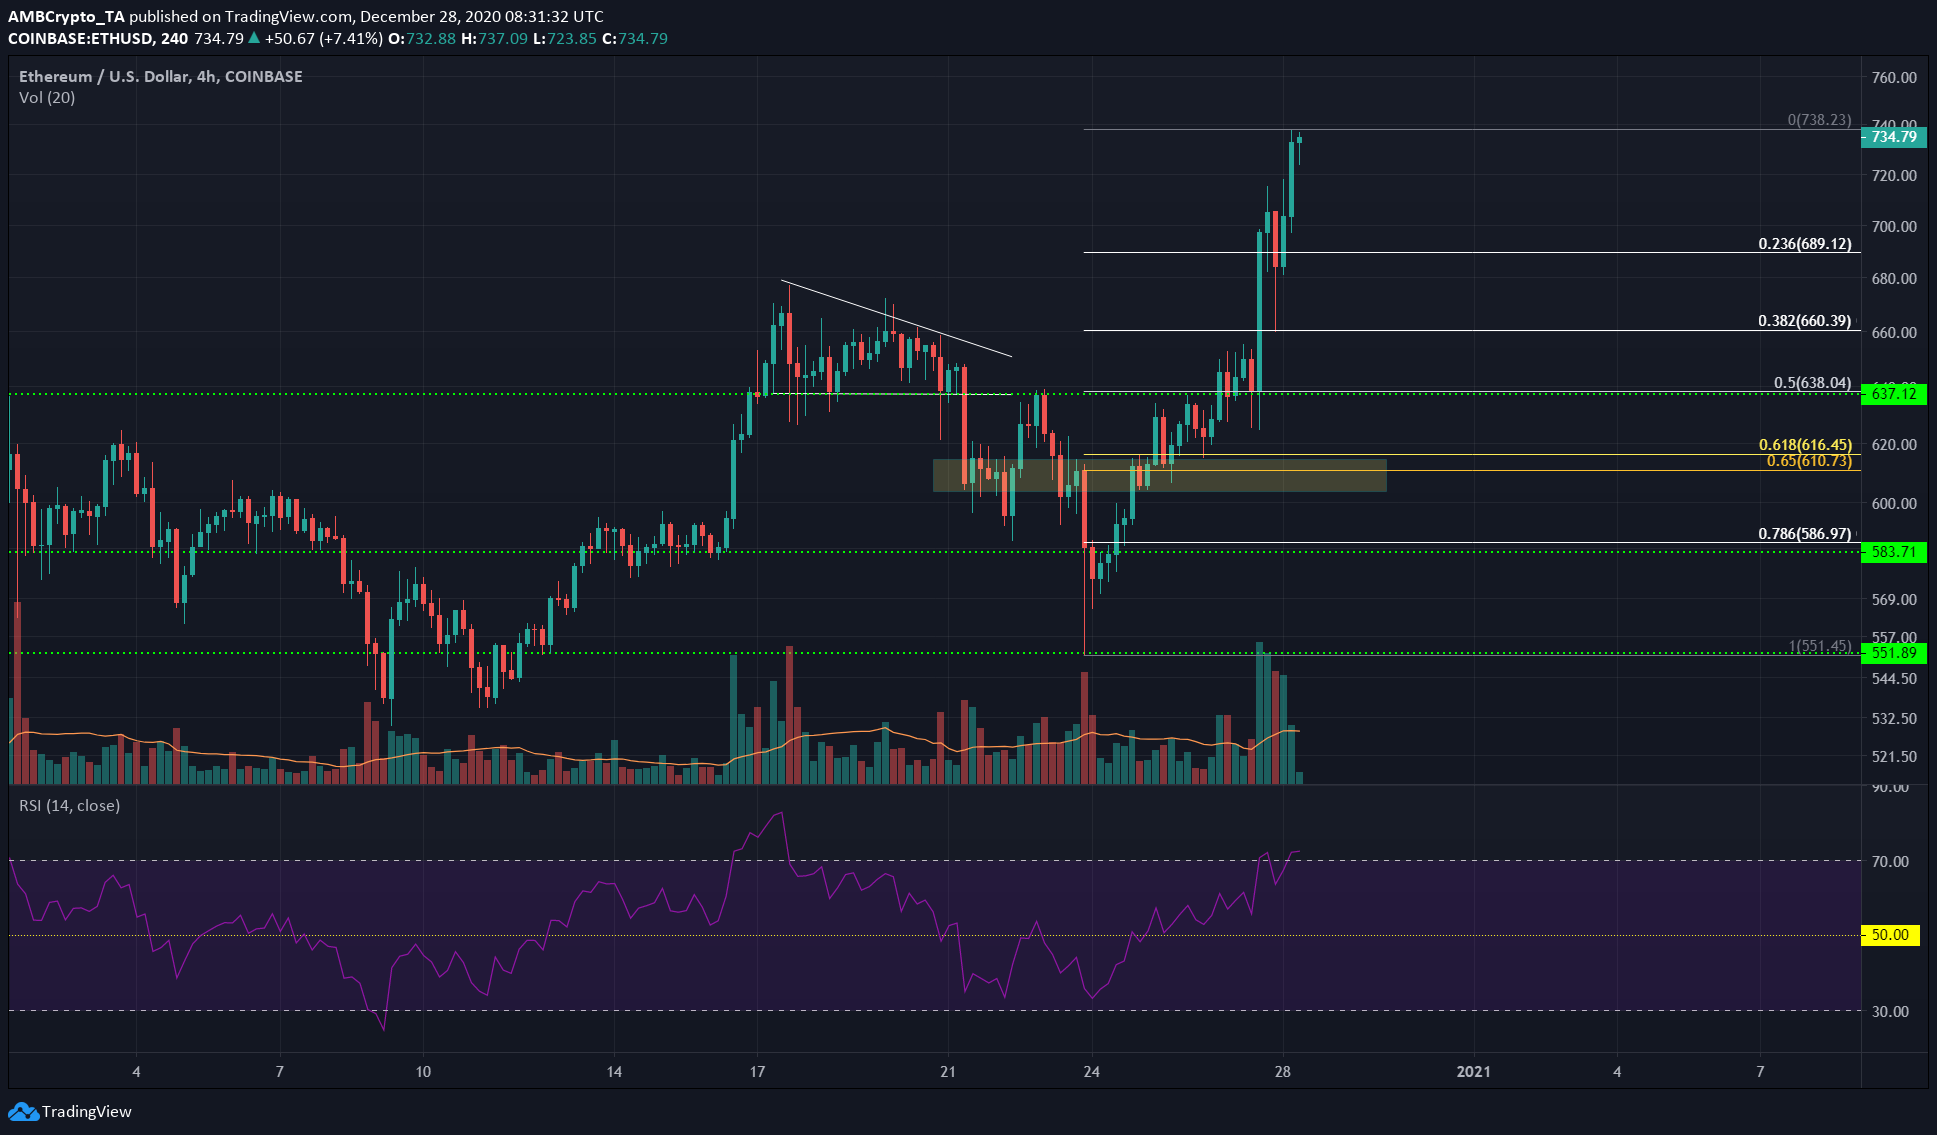
Source: ETH/USD on TradingView
Using the Fibonacci retracement tools, it was observed that the 50% retracement level and the 38.2% retracement level for ETH's move from $551 to $738 lined up almost perfectly with previous levels of resistance and support. This highlighted the validity of the swing high and the low chosen.
The 27% Fibonacci Extension gave bulls a target of $798 for ETH, upon a breakout past $740.
The RSI climbed into the overbought territory, but the extraordinary trading volume of the few hours before press time highlighted buyer conviction and pointed to further upside for ETH.
A rejection at $740-$750 could see a pullback to the 38.2% retracement level at $660 and would give a good entry to a long position.
Cosmos [ATOM]
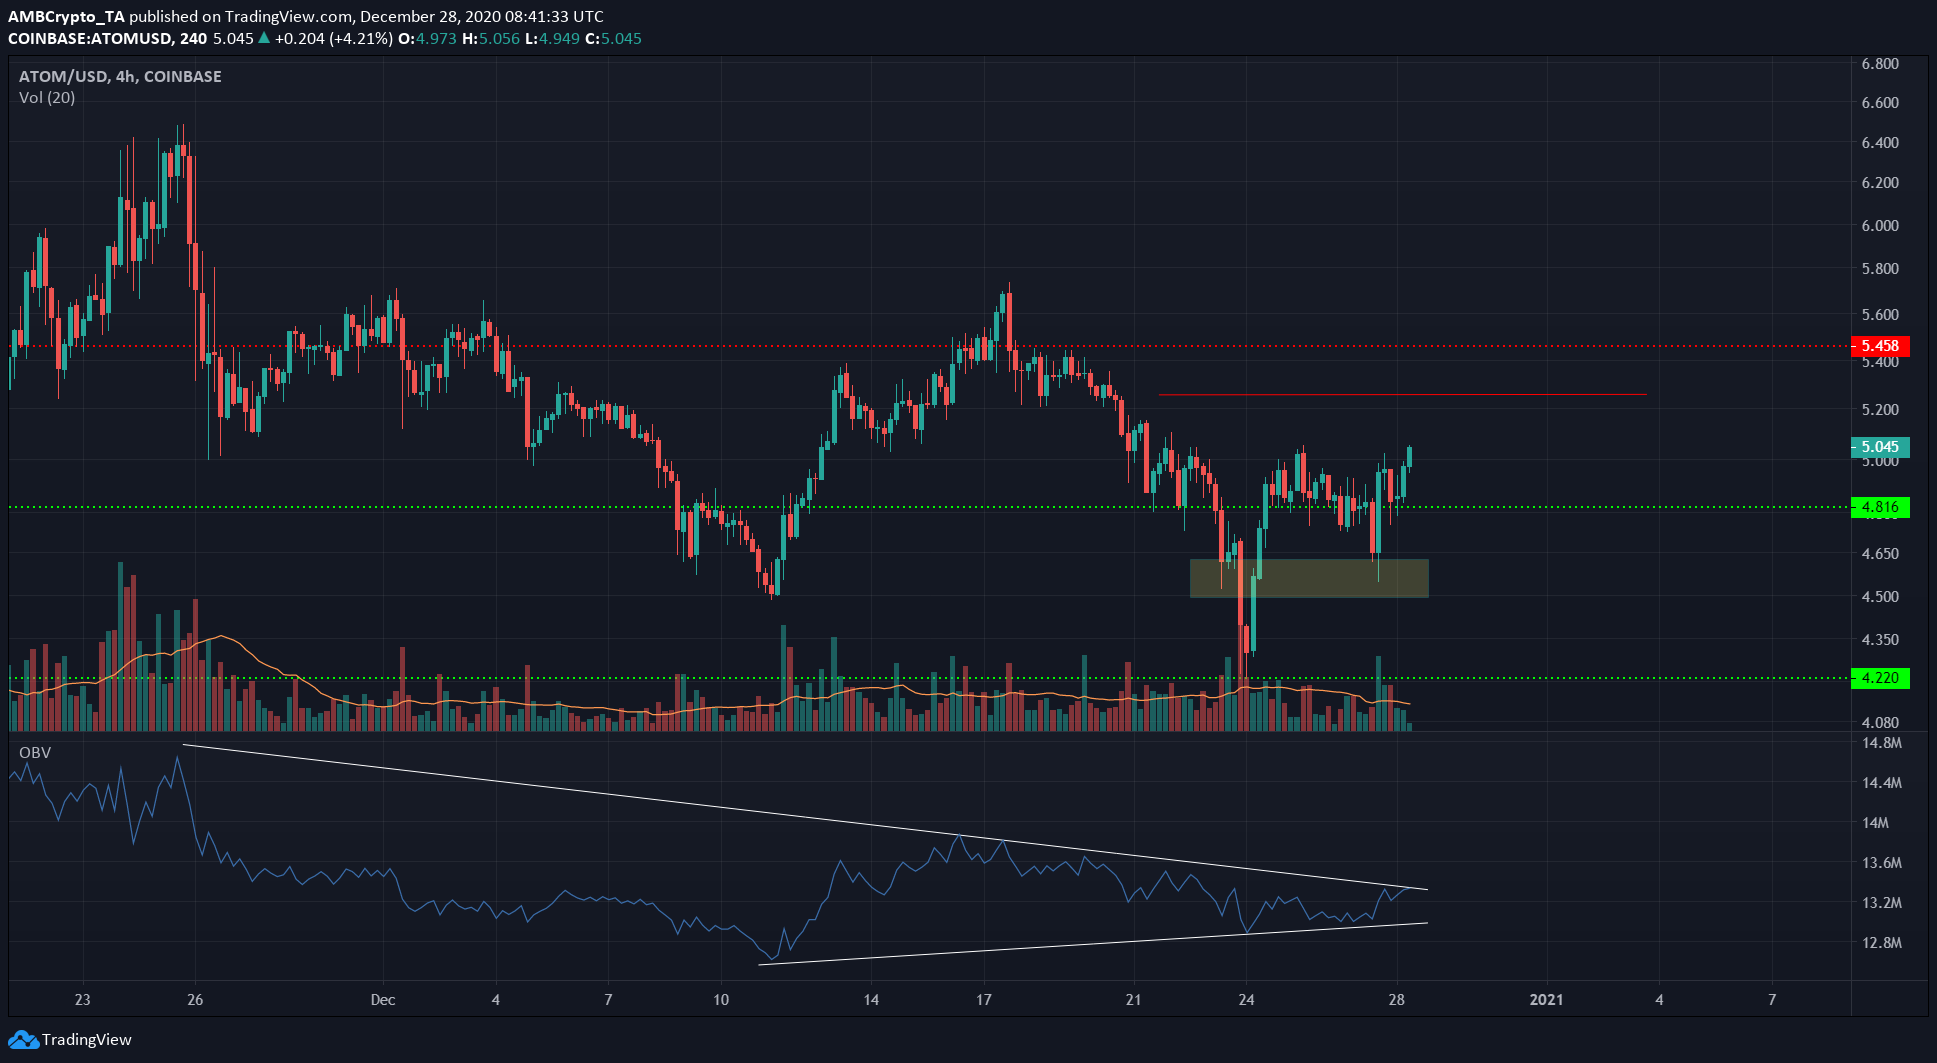
Source: ATOM/USD on TradingView
ATOM reclaimed the $4.8-level as support, yet saw a dip into the $4.60-$4.5 pocket of liquidity. At the time of writing, the digital asset gathered momentum to climb to the $5.25-level, with $5.45 as resistance above it as well.
The OBV showed that the past two weeks saw rising buying volume and yet, since late-November, the bears have been the dominant force in the market, a fact reflected both in price and on the OBV indicator.
A breakout on the OBV would be bullish and should be accompanied by rising prices as well. A flip of the $5.45-level of resistance to support would underline ATOM's move towards the $6-region.
Nano [NANO]
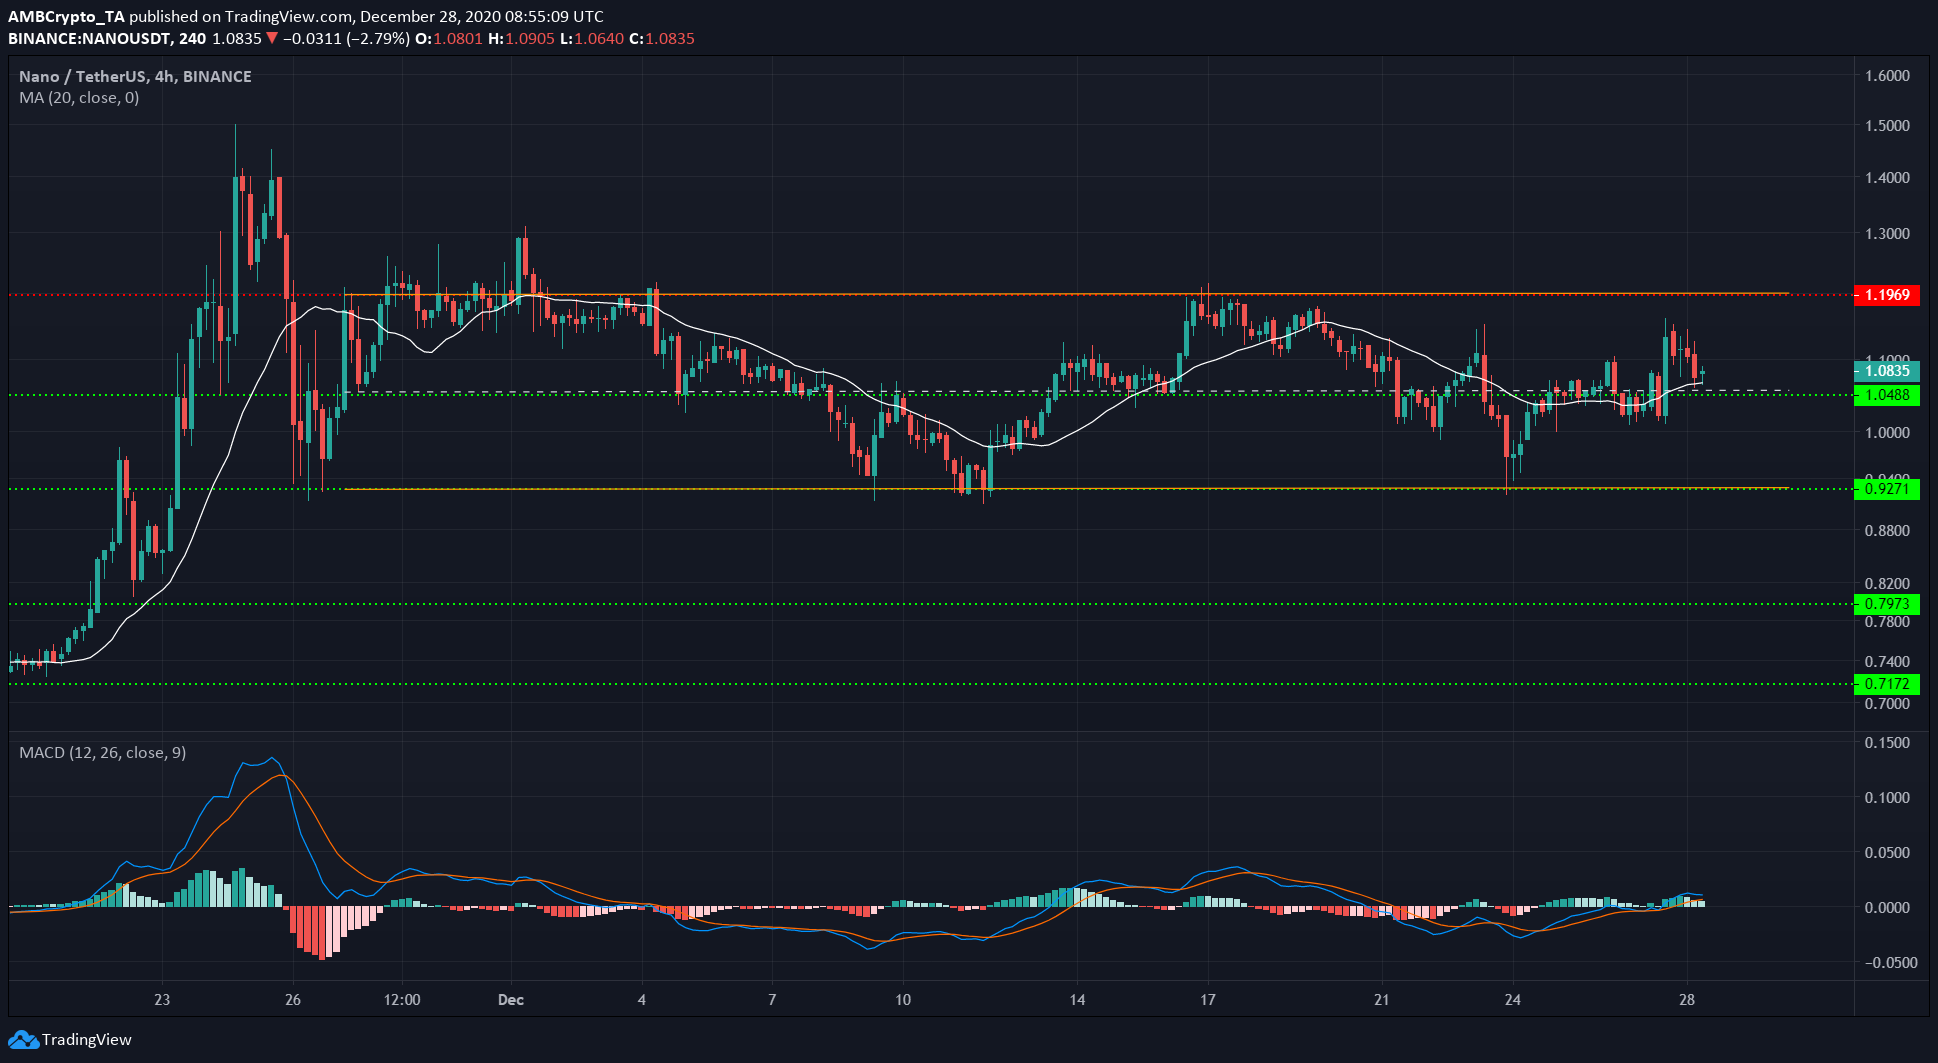
Source: NANO/USDT on TradingView
For NANO, the range with boundaries at $0.91 and $1.19, highlighted in orange, is a range it has traded within for the past four weeks. The 20 SMA (white) showed that short-term momentum swayed the price to either side of the $1-support level, a level that was also the mid-point of the range.
The MACD highlighted neutral to weak bullish momentum in the short-term, one compounded by the price being above the mid-point. A retest and bounce towards $1.19 seemed likely in the coming days.
A close below $1 would suggest a move towards $0.91 for NANO, while a close outside the range would signal a strong move in that direction for the digital asset.
The post Ethereum, Cosmos, Nano Price Analysis: 28 December appeared first on AMBCrypto.
3y ago
bullish:
5
bearish:
1
Share


 Manage all your crypto, NFT and DeFi from one place
Securely connect the portfolio you’re using to start.

bullish:
0
bearish:
0

bullish:
0
bearish:
0

