How Polkadot [DOT] investors can look to buy a dip here
0
0

Disclaimer: The findings of the following analysis are the sole opinions of the writer and should not be considered investment advice
A rising wedge pattern was spotted for Polkadot
Bearish order block heightened the likelihood of a pullback
Polkadot [DOT] has seen a strong recovery from the $5.8 zone over the past week. Technical indicators revealed a good amount of buying pressure behind this rally as well.
Here's AMBCrypto's Price Prediction for Polkadot [DOT] in 2022-23
A recent article highlighted a fall in the weighted sentiment behind Polkadot this past week. Despite this finding, however, the price has been able to maintain a positive run on the charts.
Polkadot forms a bearish pattern right beneath a resistance zone
Source: DOT/USDT on TradingView
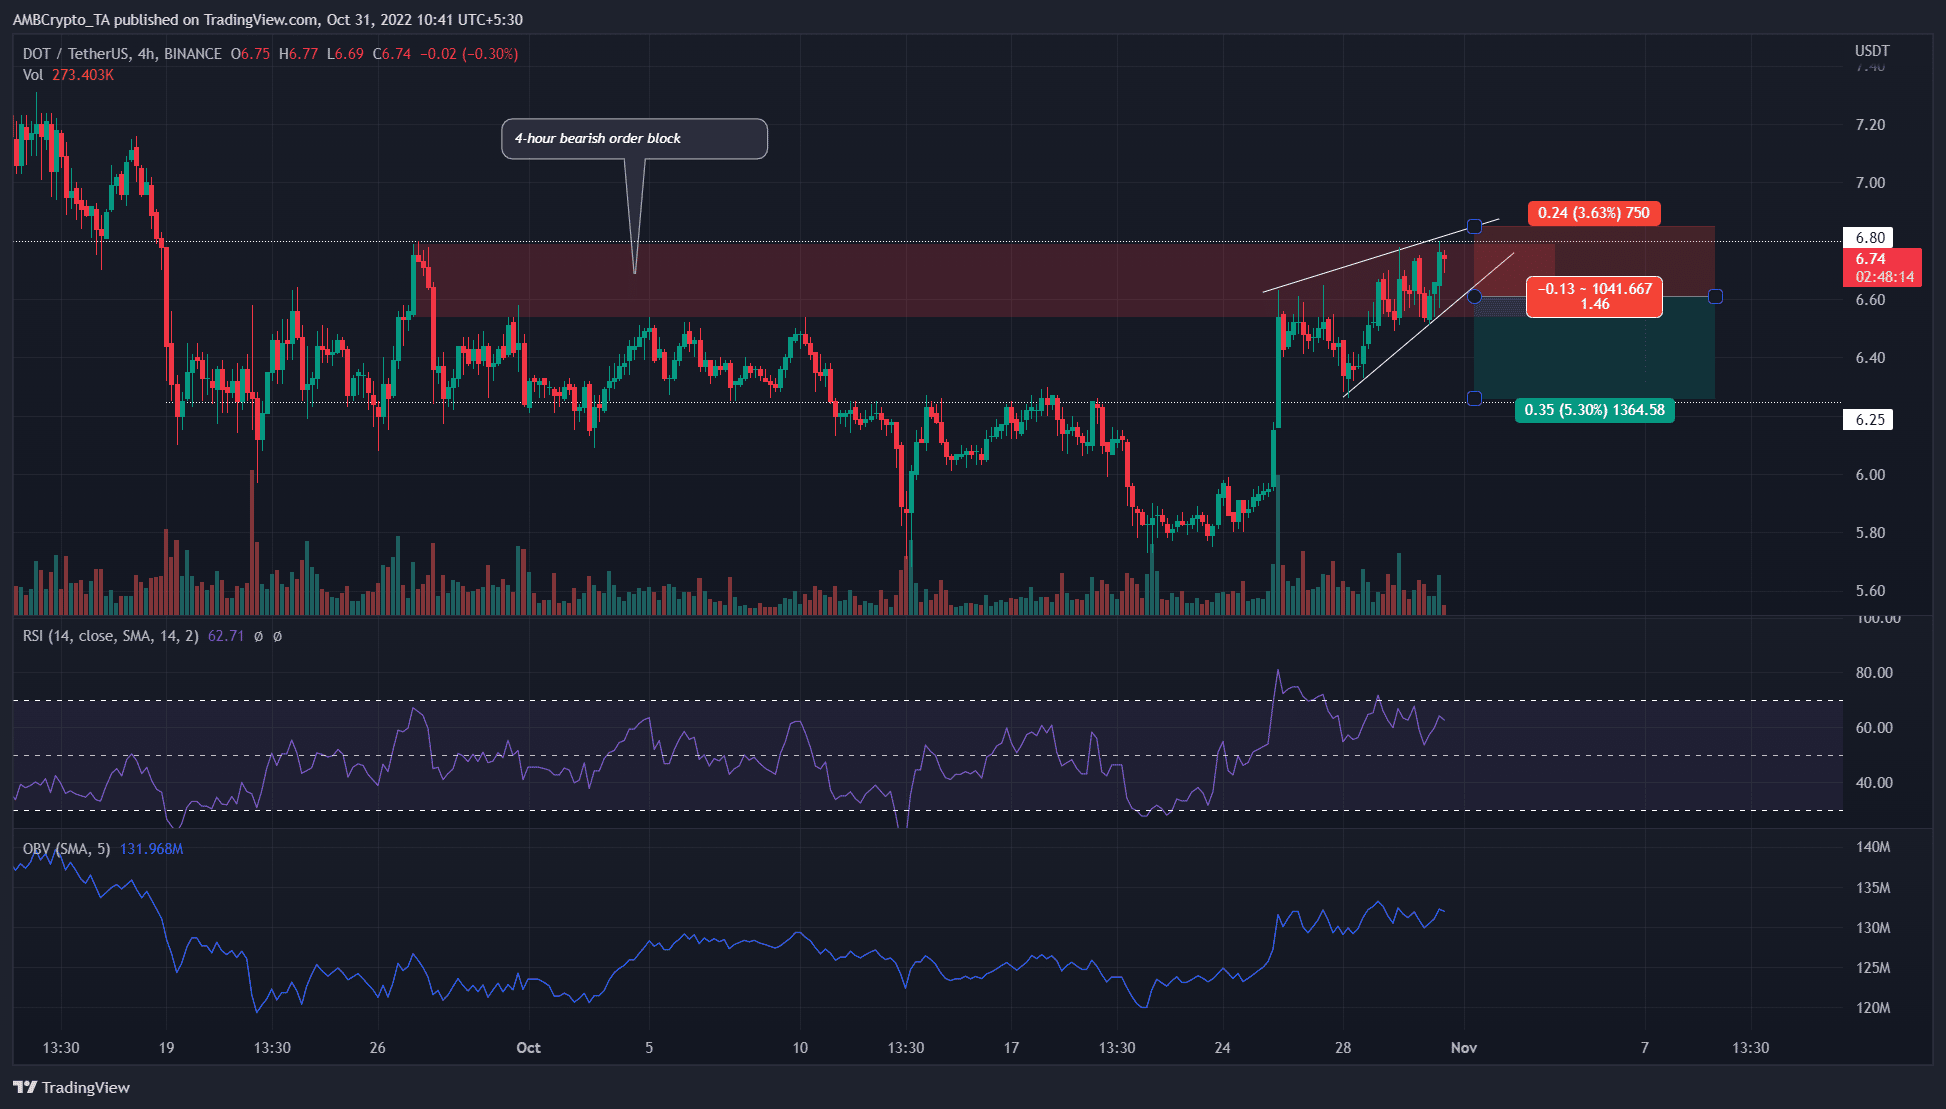
On the 4-hour chart, a bearish order block was identified in the $6.65-area. It was marked in red and signified a belt of short-term resistance. Over the past few days, the market structure has been bullish on the lower timeframes.
The daily timeframe also saw a shift in structure from bearish to bullish. This development highlighted that risk-averse traders looking to trade with the trend can look for buying opportunities.
Meanwhile, DOT formed a rising wedge pattern over the last three days. With the confluence from the resistance zone, it is likely that DOT could see a short-term pullback. The 4-hour RSI formed a bearish divergence with the price over the last two days. This reinforced the likelihood of a dip. The OBV did not show heightened selling recently as it remained flat.
This pullback could see DOT fall to the $6.15-$6.25 support zone. Not only was this a significant belt of support over the past two weeks, but it was also close to the base of the wedge pattern.
Slight rise in Open Interest, but longs have dropped over the last 24 hours
Source: Coinglass
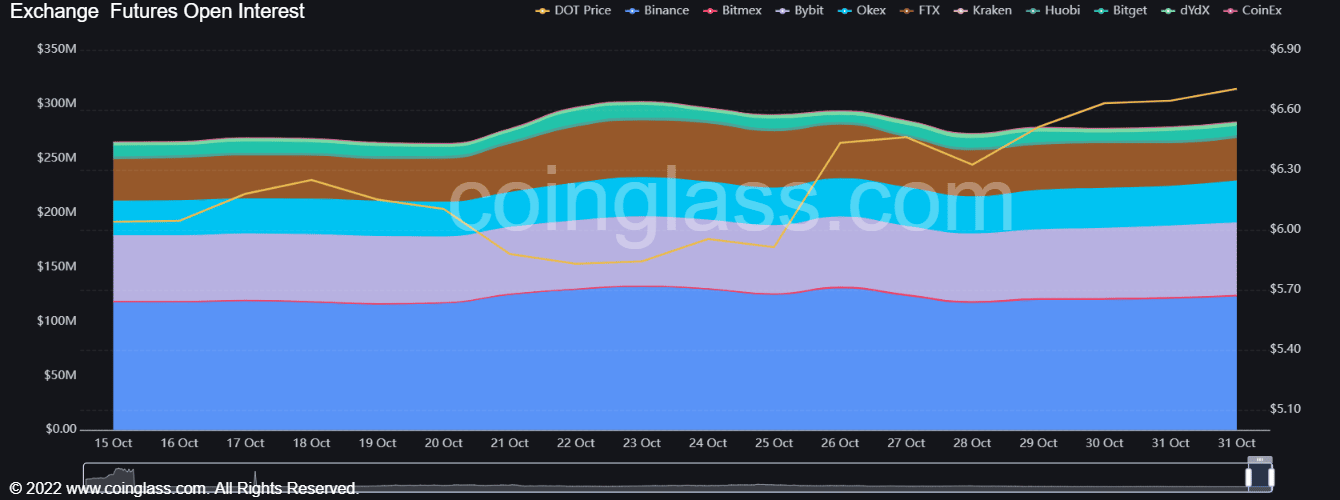
Over the past two days, the Open Interest behind DOT went up by a very slight margin. It measured close to $2 million, but this uptick came at a time when DOT gained by nearly 7%.
The Long/Short ratio was not favorable to the bulls either. The last 24 hours saw short positions register a minor victory. At press time, the ratio stood at 50.19% shorts. The funding rate was positive for DOT on Binance. This suggested that speculators have maintained a bullish outlook for DOT.
A revisit to the $6.15-$6.25 zone will likely offer a good buying opportunity. A move above $6.75 will invalidate the bearish idea based on the confluence of the rising wedge pattern and the bearish order block.
The post How Polkadot [DOT] investors can look to buy a dip here appeared first on AMBCrypto.
0
0



 すべての暗号通貨、NFT、DeFiを1か所から管理
開始に使用しているポートフォリオを安全に接続します。