EOS price rose across $2.70
4y ago
bullish:
2
bearish:
0
Share

The EOSUSD pair was observed subjected to a bullish momentum on the 6th of April. According to the daily chart for EOS, the cryptocurrency’s price line headed across the $2.700 mark, whereas the bullish run was observed to be continuous.
1-Day EOS Price Analysis (6th April)
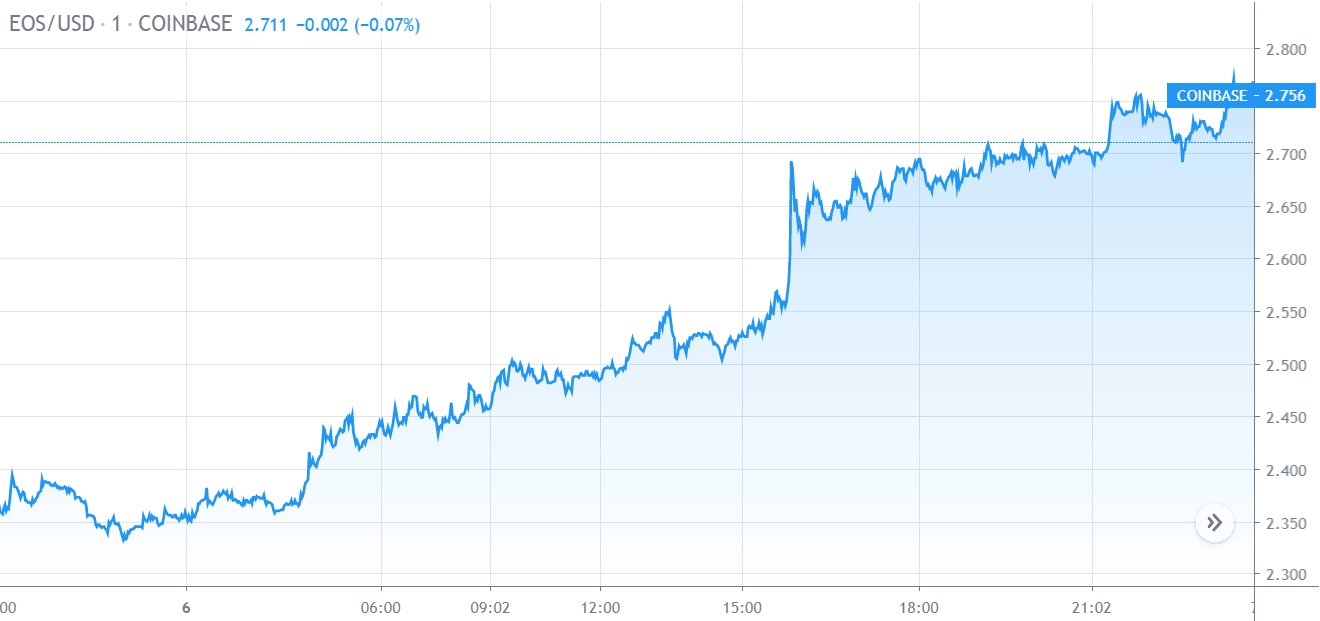
EOS Price Chart by TradingView
EOS kept near the $2.350 mark at the start of the day, the cryptocurrency traded between the $2.350 and $2.400 until it saw the bulls and gradually moved towards the $2.550 level. The cryptocurrency saw another set of bulls and the price line stepped across the $2.700 mark for EOS, where it traded at a day’s high of $2.756 US Dollars, which was also the closing price for 6th of April.
EOS: technical indicators
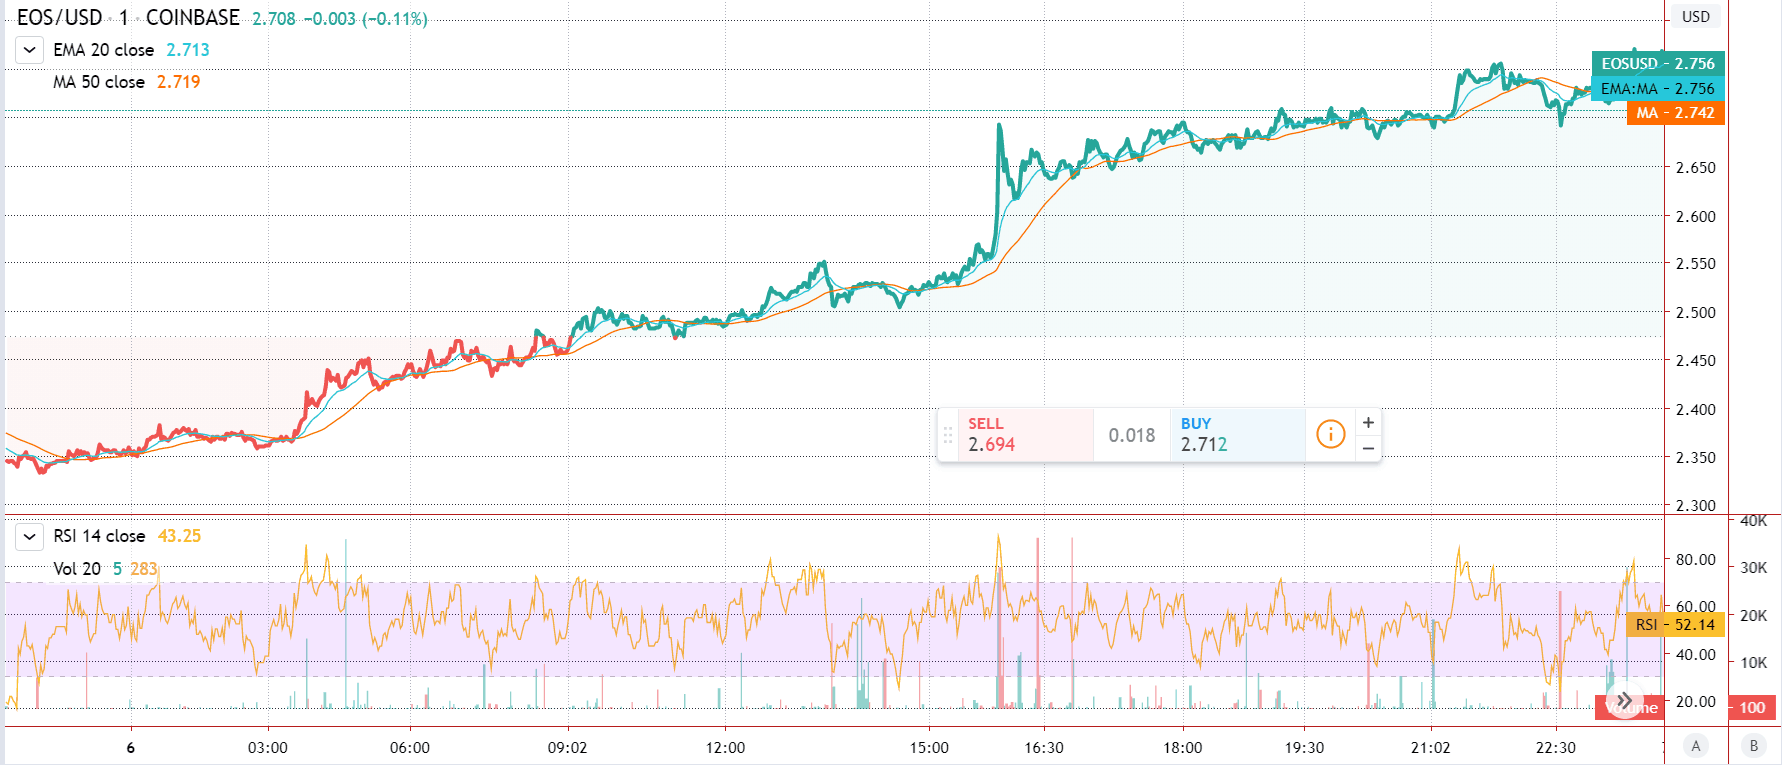
EOS Price Chart by TradingView
The 20-Day Exponential Moving Average (EMA) closed at the $2.756 mark, while the 50-Day Moving Average (MA) saw to the day’s closure at $2.742.
The Relative Strength Index (RSI) peaked at the 90.51 mark on the scale for the 6th of April. The coin was overbought at the instance, while it closed at 52.14.
Featured Image by Gerd Altmann.
Disclaimer: The information provided is not trading advice but an informative analysis of the price movement. Cryptopolitan.com holds no liability towards any investments based on the information provided on this page.
4y ago
bullish:
2
bearish:
0
Share

 Manage all your crypto, NFT and DeFi from one place
Securely connect the portfolio you’re using to start.

bullish:
0
bearish:
0


bullish:
0
bearish:
0

bullish:
0
bearish:
0