
SUI Price Prediction: Will $SUI’s ATH Dominance Drive It to $10?

0
0

SUI price prediction is suddenly getting interesting as two major signals begin to line up.
SUI has been quietly holding its ground while attention around the network is picking up fast.
At the same time, stablecoin activity on Sui has reached a level that is putting the blockchain back on traders' radar.
Recent data has highlighted Sui's growing role in stablecoin transactions, while fresh market activity is adding another layer to the story.
Now, the big question is whether this rising network activity can translate into a stronger move for SUI.
The chart is already showing signs that something could be brewing, but the real setup becomes clearer when price action and on-chain momentum are viewed together.
Here is the complete SUI price prediction setup, including what traders are watching next.
SUI Price Today: Live Data and 24-Hour Change
The token is trading at $0.8106 as of this writing, up a slight 0.01% on the day after adding roughly $0.00008, essentially flat action following a stretch of steady gains.
Futures volume over the past 24 hours comes in at $1.25 billion against spot volume of $217.76 million, showing that derivatives desks are firmly in control of today's price behavior.
Market cap currently sits at $3.34 billion, with open interest at $721.07 million, a fairly heavy leverage load relative to the size of the market that leaves room for sharp moves once a level actually gives way.
Circulating supply stands at 4.09 billion tokens against a total and max supply of 10 billion, meaning less than half of the eventual supply is currently in circulation, a detail worth factoring into any longer-range forecast for this project.
Source: CoinGlass, SUI market data, accessed September 8, 2026.
Sui Latest News: Native Stablecoin Dominance Hits Record High
This is the piece of Sui news today worth pairing with today's chart.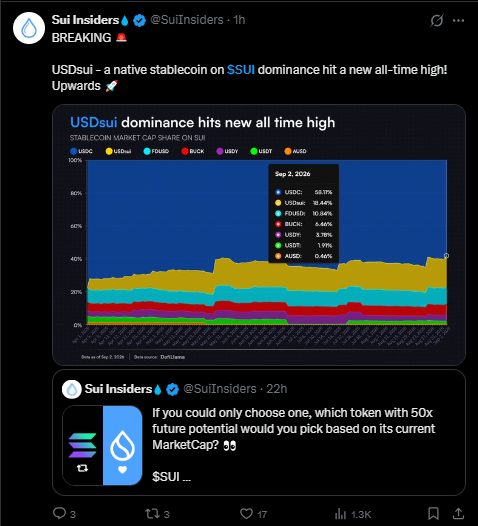
According to a post from Sui Insiders on X, USDsui, described as a native stablecoin built on this network, has seen its dominance climb to a new all-time high.
A chart shared alongside the post broke down stablecoin market cap share on the network, showing USDC still leading at 53.17%, with USDsui now sitting in second place at 18.44%, ahead of FDUSD at 10.84% and several smaller players further down the list.
A native stablecoin capturing nearly a fifth of total stablecoin share on its own chain is a meaningful signal for anyone tracking the deeper adoption story here, since it points to liquidity and usage building from within the ecosystem rather than relying entirely on outside stablecoin issuers.
Whether that shift translates into near-term price strength is a separate question, but it is exactly the kind of fundamental detail that belongs in a complete trend analysis for this network going forward.
Source: Post by Sui Insiders (@SuiInsiders) on X, referencing DeFiLlama data as of September 2, 2026.
Quick Take: Price Action At A Glance
CMP: $0.8115 (4-hour chart, Bybit)
Price is currently testing support along a rising trendline that has held through recent sessions without a confirmed break either way
4-hour trigger: a close above $0.9554 while the trendline support holds would open the path toward major resistance at $1.1671
Failure level: a close below $0.7020 would mark a trendline breakdown, with the next support at $0.6720
Momentum oscillator reading 56.38, still above the neutral midpoint even though the chart flagged a bearish tag on this leg
Data timestamp: September 8, 2026, 4h Bybit perpetual chart
Risk note: with derivatives volume this dominant relative to spot, whichever side of the trendline gives way first could see an amplified move
Technical Analysis: Trendline Test Sets Up The Next Move
Looking at the 4-hour SUIUSDT perpetual contract on Bybit, the price has been climbing gradually along a rising trendline built from a series of higher lows, and the current candle sits right at that support line once again.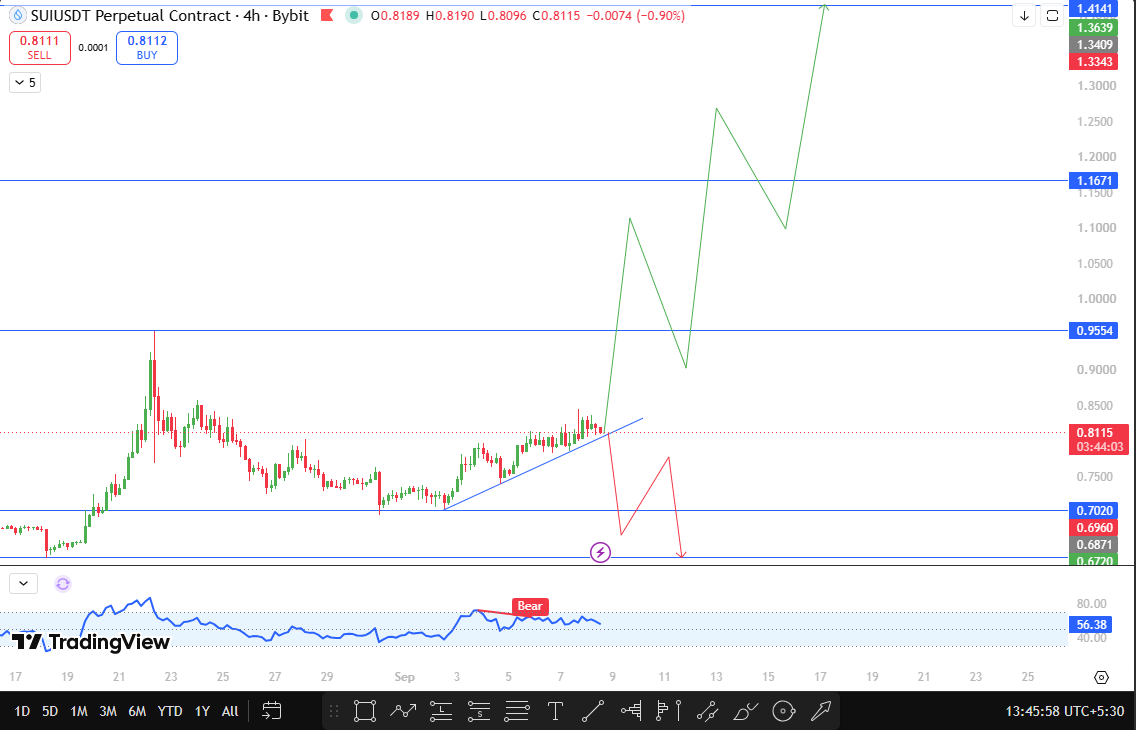
This kind of repeated test without an outright failure is generally read as the market still respecting the underlying trend, even though nothing has been confirmed just yet.
The momentum oscillator RSI here is reading 56.38, sitting above the neutral fifty mark despite a bearish tag that appeared earlier on this same leg.
A reading like that, holding above neutral even after flashing a cautionary signal, often points to buyers still having the edge for now, though it is worth watching closely given how close the price is to trendline support.
The level to watch above is $0.9554. A 4-hour close above that zone, provided the trendline support keeps holding beneath it, would put major resistance at $1.1671 into serious view, a level that lines up with where the broader structure has been building toward across recent legs higher.
On the downside, if this trendline finally breaks and the price closes below $0.7020, that would confirm a real breakdown rather than just another test.
In that case, the next support to watch sits at $0.6720, a level that would likely draw fresh interest from buyers stepping back in if sellers push things that far.
Source: TradingView, SUIUSDT Perpetual, Bybit, 4h chart, accessed September 8, 2026, 1:45 UTC+5:30.
Support and Resistance Levels to Watch
Level Type | Price | Distance From CMP |
Major Resistance | $1.1671 | +43.8% |
Resistance 1 | $0.9554 | +17.7% |
Current Price | $0.8115 | — |
Support 1 | $0.7020 | -13.5% |
Major Support | $0.6720 | -17.2% |
Bull Case, Base Case, and Bear Case
The bullish path stays open as long as this rising trendline keeps holding underneath the current price.
A confirmed close above $0.9554 would put $1.1671 in play as the next real target, and the record stablecoin dominance data gives this scenario some fundamental backing beyond just chart structure, even if that on-chain detail alone will not carry price higher by itself.
The base case has price continuing to grind along this trendline for a while longer, especially with the oscillator sitting in a somewhat mixed spot between a bullish reading and a cautionary tag.
More sideways movement while the market waits for a decisive close would not be out of the ordinary at all.
The bearish scenario plays out if the trendline finally cracks and a close lands below $0.7020.
That would flip the near-term picture bearish, and a slide toward $0.6720 becomes the more likely outcome from there, particularly if broader risk sentiment across crypto turns sour at the same time this support gives way.
Risks To This Forecast
A trendline holding through several tests is no guarantee it holds forever, and treating $0.9554 as an inevitable target would be getting ahead of what the chart has actually confirmed so far.
The heavy futures volume relative to spot activity raises the odds of a liquidation-driven spike in either direction, which could distort price action away from what the underlying structure suggests.
Broader market conditions matter here too, since a shift in sentiment across Bitcoin or the wider altcoin space could easily override this setup regardless of how the native stablecoin story develops from here.
Key Terms Explained
Ascending Trendline: A rising support line connecting a series of higher lows, used by traders to gauge whether an uptrend is still intact or has broken down.
Open Interest: The total value of outstanding derivative contracts that remain unsettled, often used as a gauge of how much leveraged money is active in a market.
Stablecoin Dominance: The share of total stablecoin market capitalization held by a specific stablecoin within a given ecosystem, often used as a rough gauge of on-chain liquidity and usage.
Disclaimer
This article is for informational purposes only and should not be taken as financial advice. Cryptocurrency markets are highly volatile, and price predictions are based on technical analysis that can change quickly with new market developments. Always conduct your own research before making any investment decisions.
0
0

 Управляйте всей своей криптовалютой, NFT и DeFi из одного места
Безопасно подключите используемый вами портфель для начала.


