Litecoin (LTC) Price Recovery in Motion – Will Bulls Reclaim $80 Next?
7M ago•

bullish:
1
bearish:
0
Share
The Litecoin (LTC) price reached a 70-day high of $72.89 today, breaking out from its range high.
The price has returned to its range high and is validating it as support. Will it bounce again?
Litecoin Moves Above Range High
The daily timeframe technical analysis for Litecoin shows that the price broke down from an ascending support line on October 9.
After a bounce, the price validated it as resistance on October 16 (red icon) before falling again. Despite this bearish movement, the cryptocurrency reversed its trend on October 19.
On October 23, it moved above the previous ascending support trendline and the $58 resistance area, which had served as the range high since August.
Crypto investing, simplified. Get LTC price predictions here.
The LTC price reached a high of $72.89 today, the highest since August 16.
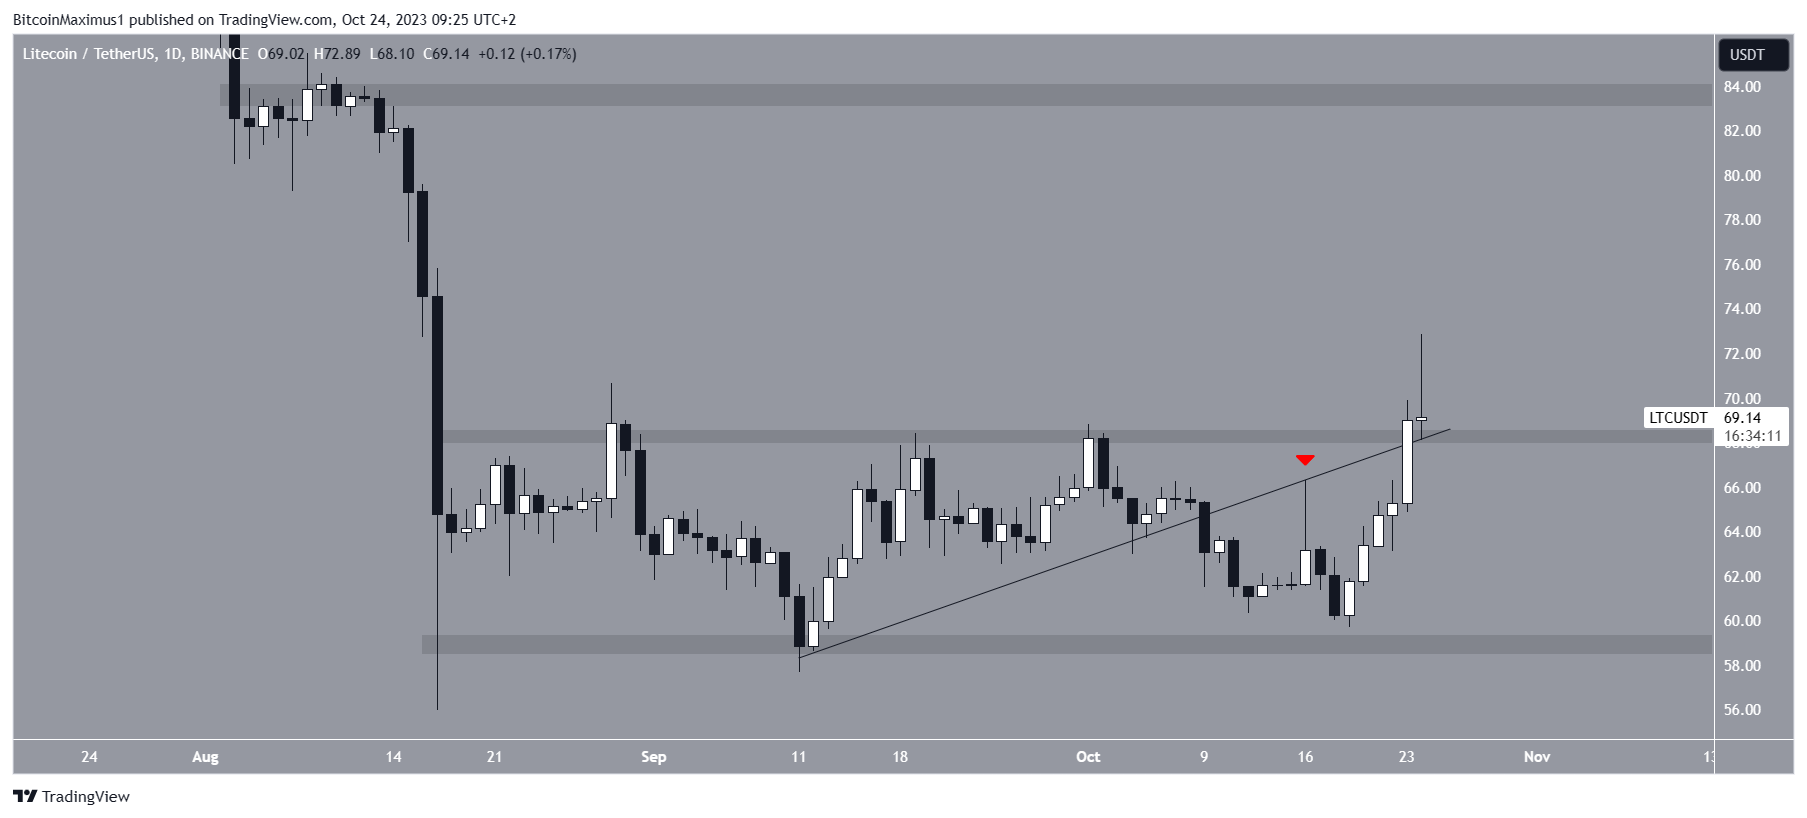 LTC/USDT Daily Chart. Source: TradingView
There is some interesting Litecoin news today. Litecoin long-term holders have bought significant amounts of LTC since October, causing the Holders Net-Inflows metric indicator to reach a two-year peak.
The Litecoin Foundation announced that it produced 999 silver 50-gram collectible cards with a Litecoin block reward. At present, the cards are selling for $840.
Check Out the Best Upcoming Airdrops in 2023
What Are the Analysts Saying?
Cryptocurrency analysts on X are predominantly bullish about the LTC price movement.
FuryMetaa stated that he believes a breakout from the range high will occur. Since the tweet, a breakout has occurred.
Similarly, SantoXBT and KongBTC have predicted a next leg up, with a potential future target of $92.
Will this target be reached?
LTC Price Prediction: Will Breakout Continue?
The daily RSI supports the continuing of the increase. With the RSI as a momentum indicator, traders can determine whether a market is overbought or oversold and decide whether to accumulate or sell an asset.
Bulls have an advantage if the RSI reading is above 50 and the trend is upward, but if the reading is below 50, the opposite is true. The RSI is above 50 and increasing, both signs of a bullish trend.
Also, the indicator’s bullish divergence trendline (green line) is still intact, solidifying the validity of the breakout.
If the Litecoin price increase continues, the altcoin can reach the next resistance at $83, 21% above the current price.
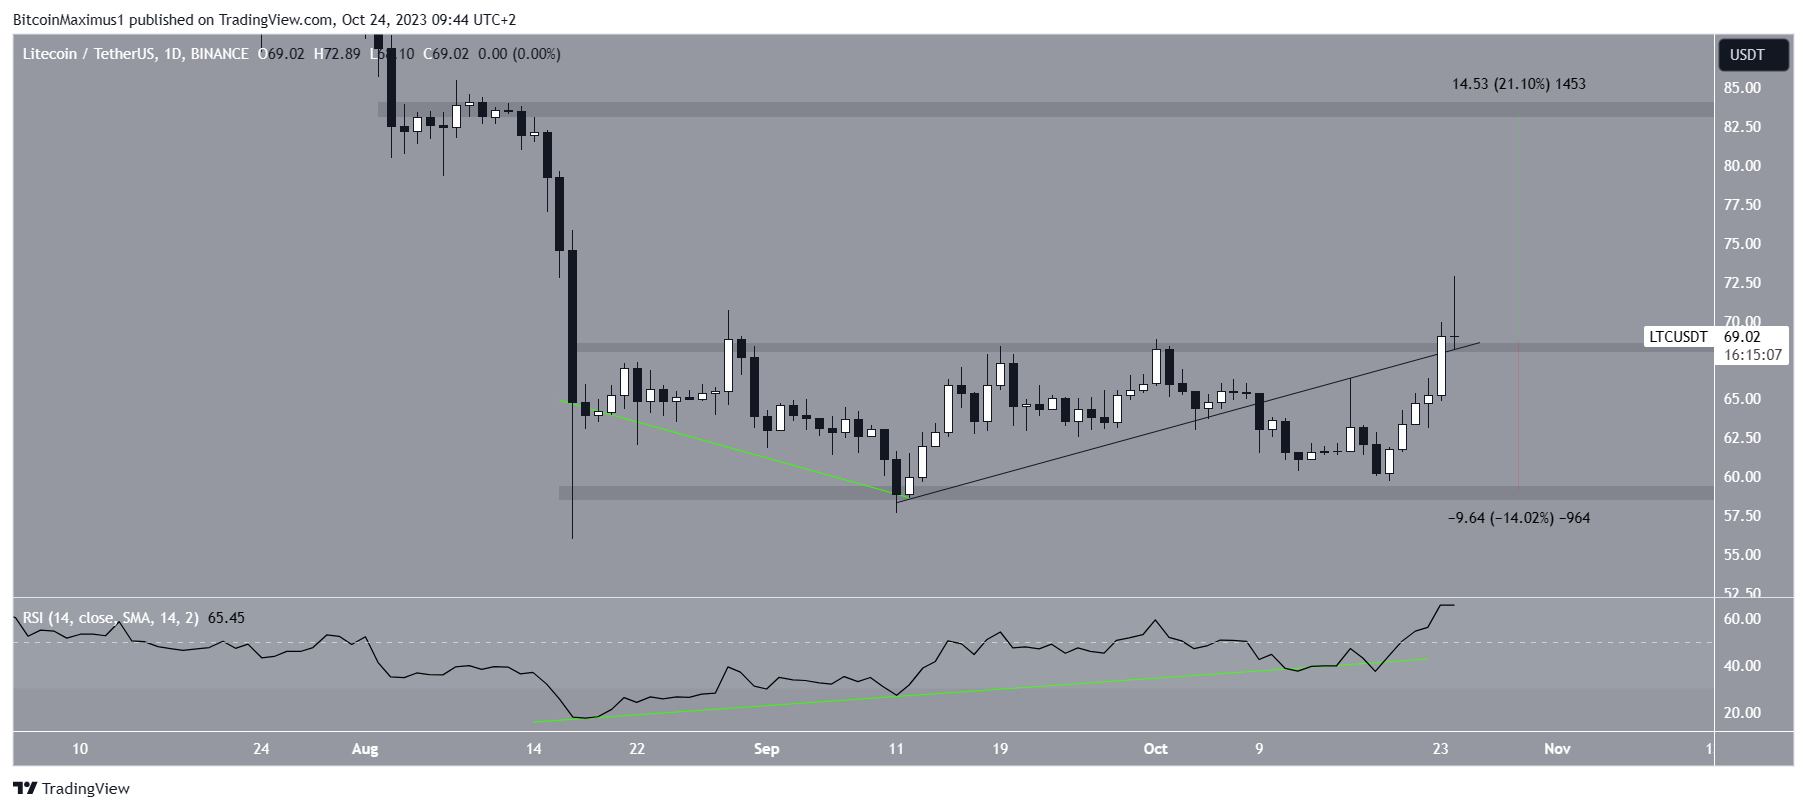 LTC/USDT Daily Chart. Source: TradingView
Despite this bullish LTC price prediction, a close below the $68 horizontal area will invalidate the breakout.
In that case, a 14% drop to the closest support at $58 will likely be the future outlook.
Check Out the Top 11 Crypto Communities To Join in 2023
For BeInCrypto’s latest crypto market analysis, click here.
7M ago•
bullish:
1
bearish:
0
Share


 Manage all your crypto, NFT and DeFi from one place
Securely connect the portfolio you’re using to start.

bullish:
0
bearish:
0


bullish:
0
bearish:
0

bullish:
0
bearish:
0