SPACE ID Price Prediction 2024 -2030: Is ID a Good Investment?

0
0
Key Takeaways
- Our SPACE ID predictions anticipate a high of $1.05 by the end of 2024.
- In 2025, it will range between $1.40 and $1.63, with an average price of $1.44.
- In 2030, it will range between $9.01 and $10.59, with an average price of $9.26.
SPACE ID has risen 22.88% since its initial listing on Binance. Over the last 30 days, it has dropped 4% and remains range-bound in the short term. In the long term, SPACE ID is set to trend higher.
The SPACE ID token (ID) has three core functions. You can stake it to earn passive income, use it as a payment token for transactions, and use it as a governance token for the SPACE ID ecosystem. SPACE ID lets you personalize your wallet address in a human-readable format, a universal name service network.
Is ID a good investment? Will ID price rise? Where will it be in 5 years? We answer these questions and more in our Cryptopolitan Price Prediction.
Overview
| Cryptocurrency | SPACE ID |
| Ticker | ID |
| Current Price | $0.7354 |
| Market Cap | $411,683,987 |
| 24-hour Trading Volume | $34,643,375 |
| Circulating Supply | 552,473,098 |
| All-time High | $1.83 on Mar 17, 2023 |
| All-time Low | $0.1713 on Oct 20, 2023 |
| 24-hour High | $0.7547 |
| 24-hour Low | $0.7123 |
SPACE ID Price Prediction: Technical Analysis
| Metric | Value |
| Volatility (30-day Variation) | 3.66% |
| 50-day SMA | $0.805 |
| 200-day SMA | $0.576 |
| Sentiment | Bearish |
| Fear & Greed Index | 74 (Greed) |
| Green Days | 11/30 (37%) |
SPACE ID Price Analysis: ID in Consolidation
TL; DR
- ID consolidated for two months before breaking out in March
- The range is slim, and it could break out in either direction.
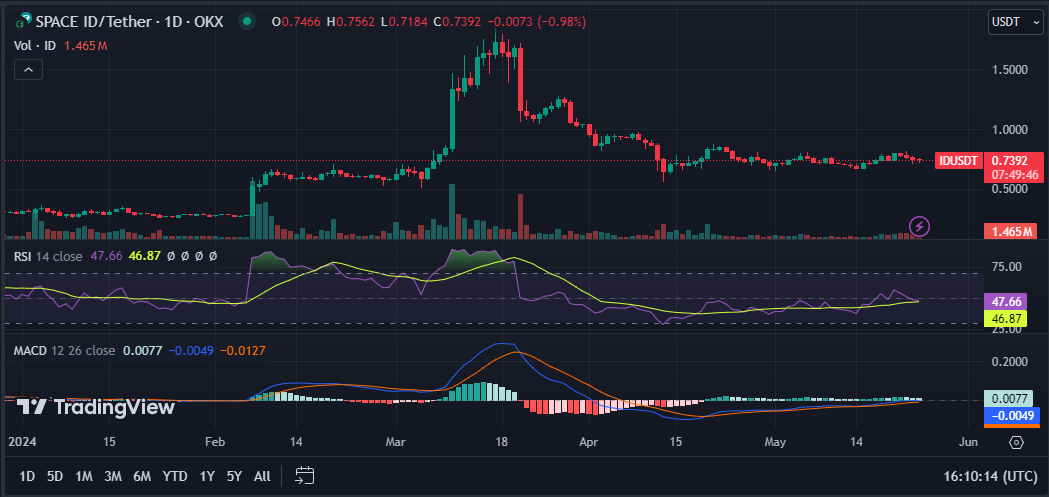
ID/USD 1-day Chart: ID in Consolidation
ID Space consolidated for two months before breaking out in March. It rose from a low of $0.30 to a peak of $1.84, a 600% gain. At the level it was overbought, the preceding reversal forced it to $0.7. It is consolidating with the relative strength index at 46.87.
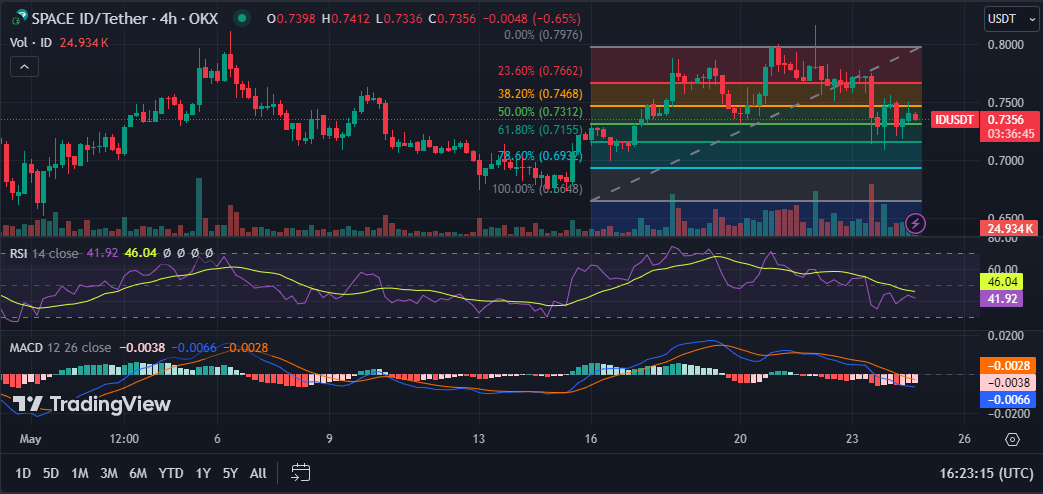
ID/USD 4-hour Chart: ID negative momentum is slowing
Zoomed in, ID is volatile. Its negative momentum is slowing, with support at 61.80 Fibonacci. The range is slim, and it could break out in either direction.
SPACE ID Technical Indicators: Levels and Action
Daily Simple Moving Average (SMA)
| Period | Value ($) | Action |
| SMA 3 | 0.777 | SELL |
| SMA 5 | 0.762 | SELL |
| SMA 10 | 0.753 | SELL |
| SMA 21 | 0.740 | SELL |
| SMA 50 | 0.805 | SELL |
| SMA 100 | 0.856 | SELL |
| SMA 200 | 0.576 | BUY |
Daily Exponential Moving Average (EMA)
| Period | Value ($) | Action |
| EMA 3 | 0.746 | SELL |
| EMA 5 | 0.746 | SELL |
| EMA 10 | 0.746 | SELL |
| EMA 21 | 0.766 | SELL |
| EMA 50 | 0.819 | SELL |
| EMA 100 | 0.770 | SELL |
| EMA 200 | 0.636 | BUY |
What to Expect from ID Price Next?
The current SPACE ID sentiment is bearish, while the Fear & Greed Index shows 74 (Greed). Space ID recorded 11/30 green days with 3.66% price volatility over the last 30 days. The charts show ID is in consolidation, but the direction of the next breakout is not apparent.
Is ID a Good Investment?
ID has utility; this year, it registered more trading volumes, contributing to its recent price gains. SPACE ID also registers new domains through collaborations from major blockchains. The predictions are also optimistic.
Recent News/ Updates
- SPACE ID collaborates with BEVM (a BTC layer 2) to introduce decentralized .bevm identities.
Also Read: SPACE ID Expands Web3 Horizons with .sol Domain Support and SDK Integration.
SPACE ID Price Prediction May 2024
SPACE ID’s price will break higher than the current levels. This month, the average price will be $0.77, ranging between $0.70 and $0.80.
| Month | Potential Low | Potential Average | Potential High |
| May | $0.70 | $0.77 | $0.80 |
SPACE ID Price Prediction 2024
As the second half of 2024 unfolds, we anticipate ID trading at an average price of $0.85, ranging between $0.70 and $1.05.
| Year | Potential Low | Potential Average | Potential High |
| 2024 | $0.70 | $0.85 | $1.05 |
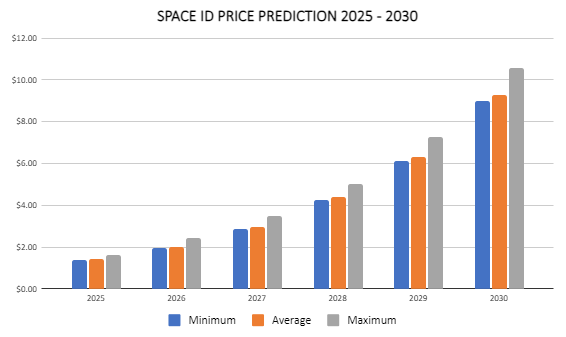
SPACE ID Price Prediction 2025 – 2030
| Year | Potential Low ($) | Potential Average ($) | Potential High ($) |
| 2025 | 1.40 | 1.44 | 1.63 |
| 2026 | 1.95 | 2.02 | 2.42 |
| 2027 | 2.88 | 2.96 | 3.48 |
| 2028 | 4.27 | 4.39 | 5.01 |
| 2029 | 6.14 | 6.31 | 7.29 |
| 2030 | 9.01 | 9.26 | 10.59 |
SPACE ID Price Prediction 2025
The SPACE ID forecast for 2025 is a high of $1.63. However, in the case of a crypto market correction, the ID price might rest at a minimum price of $1.40, making an average of $1.44.
SPACE ID Price Prediction 2026
The year 2026 will experience more bullish momentum. According to the SPACE ID price prediction, it will range between $1.95 and $2.42, with an average trading price of $2.02.
SPACE ID Price Prediction 2027
The price of SPACE ID prediction climbs even higher into 2027. According to the prediction, it will range between $2.8 8and $3.48, and an average price of $2.96.
ID Price Prediction 2028
The analysis suggests a further acceleration in SPACE ID growth by 2028. According to the ID price prediction, the ID price will reach a minimum of $4.27, a maximum of $5.01, and an average of $4.39.
ID Price Prediction 2029
According to the SPACE ID price prediction for 2029, the SPACE ID price will reach a maximum and minimum of $7.29 and $6.14, respectively, with a year-round average of $6.31.
SPACE ID Price Prediction 2030
The ID coin price prediction for 2030 indicates a price range of $9.01 and $10.59 and an average price of $9.26.
SPACE ID Market Price Prediction: Analysts ID Price Forecast
| Firm | 2024 | 2025 |
| DigitalCoinPrice | $1.46 | $1.67 |
| CryptoPredictions | $1.36 | $1.38 |
| Gate.io | $0.73 | $0.76 |
Cryptopolitan’s ID Price Predictions.
According to our predictions, SPACE ID will reach a high of $1.05 in the second half of 2024. In 2025, it will range between $1.40 and $1.63, with an average price of $1.44. It will achieve a new all-time high in 2026 at $2.42. In 2030, it will trade between $9.01 and $10.53.
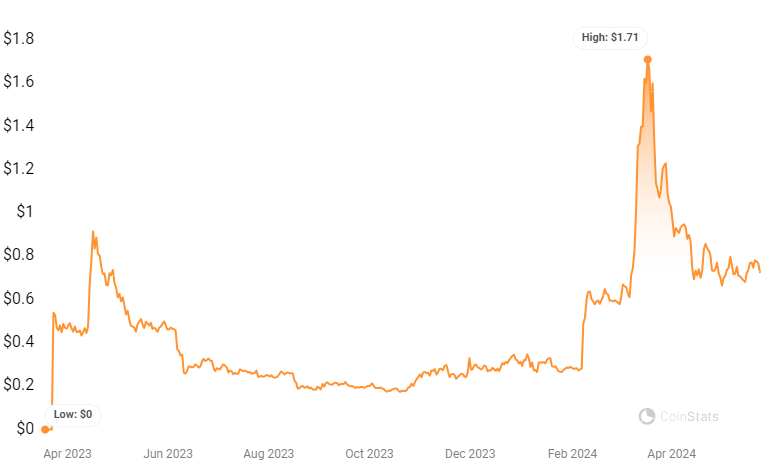
SPACE ID Historic Price Sentiment
- Binance Launchpad subscription for ID started on March 17th, 2023.
- The token distribution started on March 22nd, 2023.
- Binance chart data shows that it started trading at around $0.3.
- A month later, it rose to a high of $0.9 and began a bear run that lasted a year.
- On Oct 20, 2023, it registered its all-time low at $0.1713.
- 2024 registered higher trading volumes, which accompanied a price rise.
- On March 17, 2024, it registered its all-time high at $1.83.
0
0


 Manage all your crypto, NFT and DeFi from one place
Securely connect the portfolio you’re using to start.