DOT Price Prediction: Polkadot Tests Market Nerves as Real-World Adoption Meets Bearish Forecasts

0
0
Polkadot’s DOT token is trading in the mid-$2 range as traders watch how new real-world demand will shape the market in the coming weeks. As per Coingecko data, DOT, the native asset of the Polkadot network, moved around $2.61 over the past day. It is down about -3% in 24 hours and +5.7% for the week.
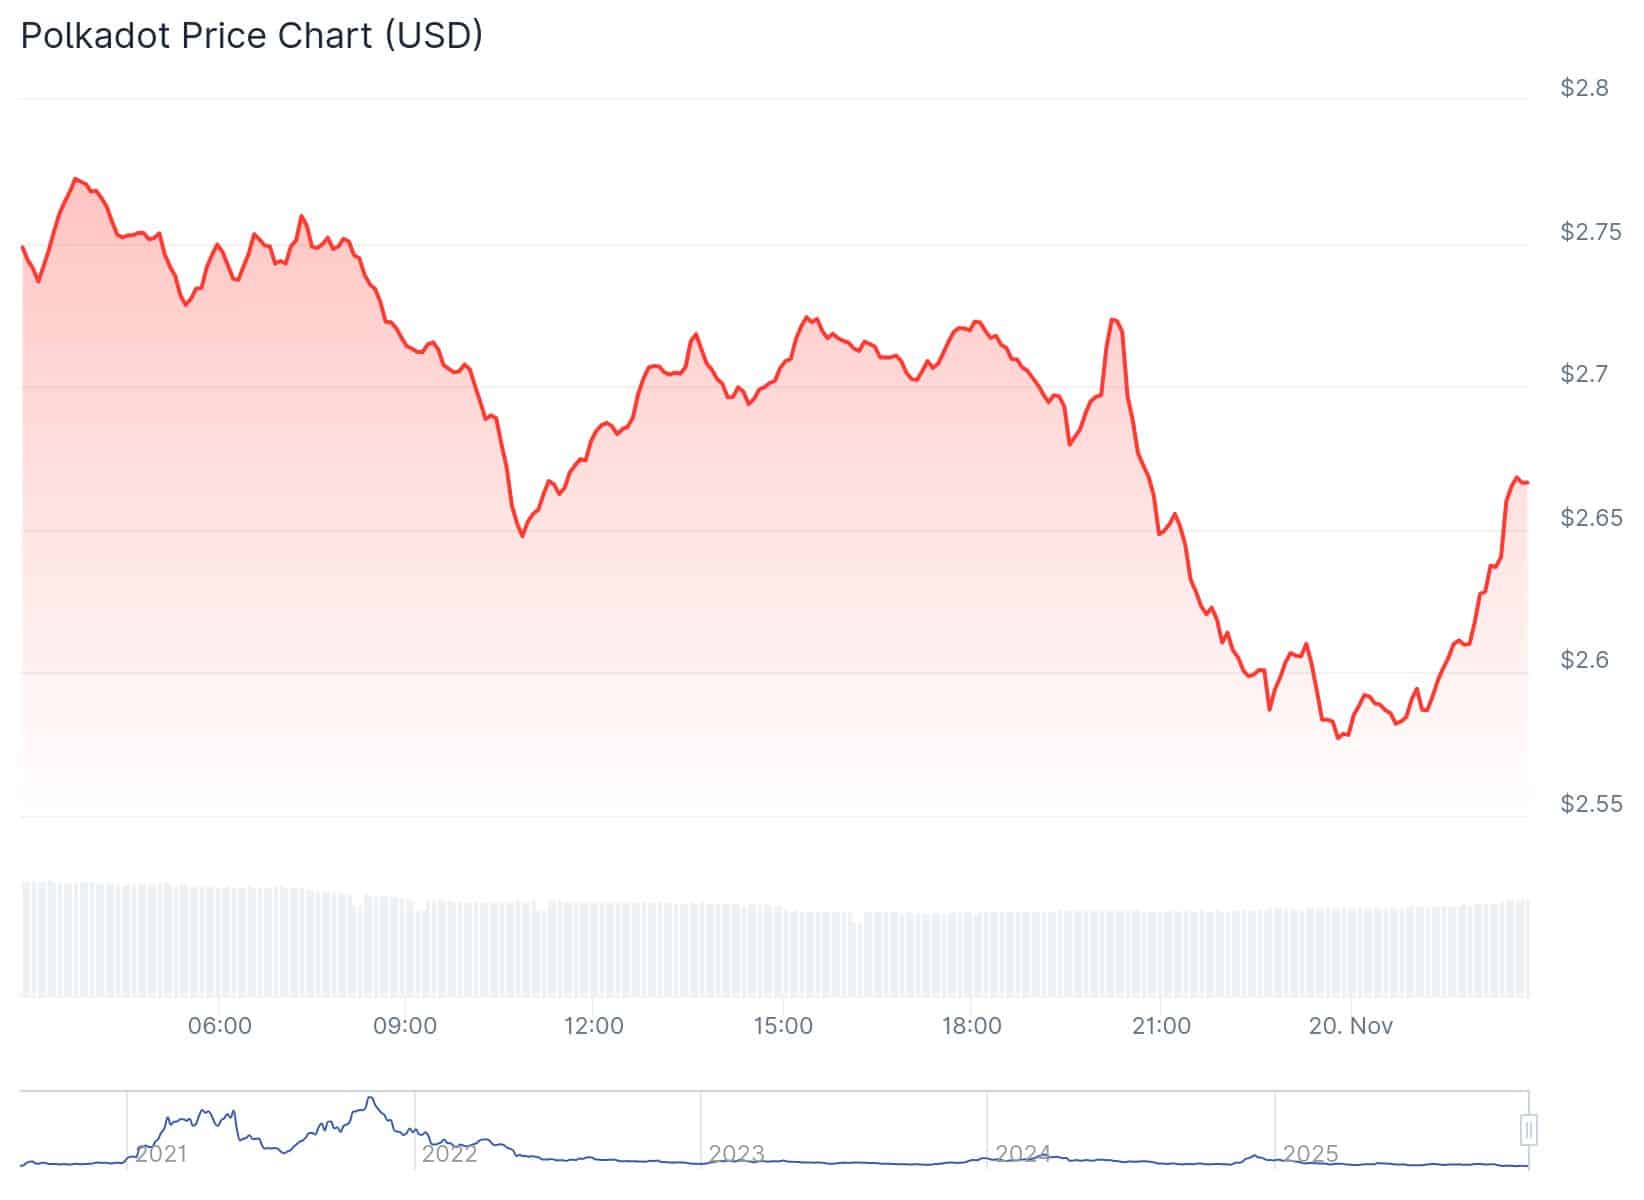
DOT’s market value is near $4.27Bn, with roughly $207M in daily trading volume. The move came on November 20, during a broader market that is still holding above $3 trillion. Even so, sentiment remains weak. The Crypto Fear & Greed Index sits at 16/100, showing deep caution across the market.
Traders remain split on whether DOT can gain momentum while Bitcoin trades close to its highs.
DISCOVER: Top Solana Meme Coins to Buy in 2025
What Benefits Do Guests Get When Paying With Stablecoins Through Polkadot?
Polkadot’s governance made a major shift in September. The network approved Referendum 1710, which set a hard limit of 2.1 billion DOT and moved issuance to a new “Hard Pressure” curve.
This change slows future inflation and is meant to create a more predictable supply path for the ecosystem.
Analysis from CoinGecko’s GeckoPulse shows that Polkadot’s annual emissions are on track to drop by more than half by 2026. That shift points to a tighter long-term supply than what the network had in earlier years.
The project is also pushing into payments. Las Golondrinas Hotels, a surf-lifestyle chain with properties across Latin America, confirmed a new partnership this week. The group will accept USDT and USDC through Polkadot’s Asset Hub.
Guests who pay with stablecoins will get a 20% discount, and the company says transaction fees will stay “under one cent.”
DISCOVER: Best New Cryptocurrencies to Invest in 2025
DOT Price Prediction: Could the Long-Term Descending Trendline Break Push DOT Toward $50?
On the weekly chart, DOT shows a long compression pattern that now sits close to a major breakout point.
The token has spent more than two years moving inside a broad Wyckoff-style accumulation range between about $3 and $7.
The lower band has held firm through repeated tests, showing steady demand. Each retest has drawn a stronger reaction in volume, a sign that sellers are being absorbed as the structure moves into its final stages.
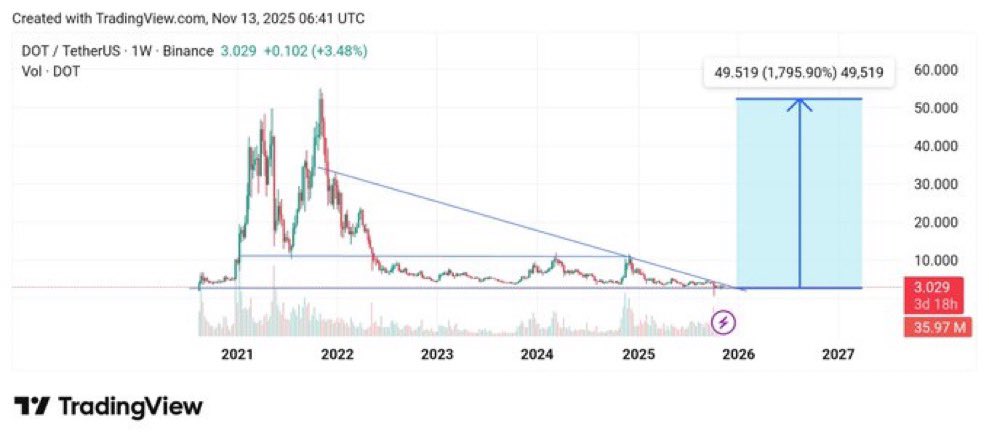
A long descending trendline from the 2021 peak has blocked every rally so far, and DOT is now pushing right against it. There’s almost no space left in the triangle, which puts the token at a decision point.
The chart marks this area as a possible breakout zone and supports the analyst’s view that institutional buying may have wrapped up. The structure shows the usual signs seen in classic setups: a steady base, lower volatility, and lighter supply at the lows.
The projection on the chart points toward a sharp move if the price breaks out. The upside target sits near $50, which would be close to a 1,800% jump from current levels. This area lines up with the major high-volume zones from the 2021 cycle, hinting at a possible return to older trading ranges if a markup phase starts.
For now, DOT is still moving inside its range. But the pattern shows that the next strong move, either higher or lower, will likely appear once this tight consolidation ends.
EXPLORE: What is Fidelity Wise Origin Bitcoin Fund (FBTC)?
Join The 99Bitcoins News Discord Here For The Latest Market Updates
The post DOT Price Prediction: Polkadot Tests Market Nerves as Real-World Adoption Meets Bearish Forecasts appeared first on 99Bitcoins.
0
0

 Gerencie todo seu criptograma, NFT e DeFi de um só lugar
Conecte com segurança o portfólio que você está usando para começar.