Polkadot (DOT) Struggles to Break $5 Due to Market Pressures

1
0

Polkadot’s (DOT) price has plummeted over 10% in the past week. Monday’s market troubles caused it to trade below the $5 price level for the first time since November 2023. On that day, the altcoin even plunged to a low of $3.75 before rebounding.
Currently trading at $4.59, DOT now faces a steep climb back above the $5 mark.
Polkadot Faces Headwinds as It Attempts to Reclaim $5
DOT’s key technical indicators assessed on a one-day chart suggest that a break above the $5 price mark might be challenging as selling pressure gains momentum.
As of this writing, readings from DOT’s Directional Movement Index (DMI) show its negative directional indicator (-DI) (red) resting above its positive directional indicator (+DI) (blue)
An asset’s DMI measures the strength and direction of its market trend. The downtrend is strong when the +DI line is below the -DI line. This means that sellers have more control over the market than buyers.
The greater the distance between the -DI and the +DI, the stronger the downward momentum. In DOT’s case, the downtrend is significant as the -DI line is 40.69, while the +DI line is 6.20.
Further, DOT’s Average Directional Index (ADX) (yellow) is in an uptrend at 43.37. Generally, when an asset’s ADX is rising while the -DI is above the +DI, it indicates that the downward trend is strong and likely to continue.
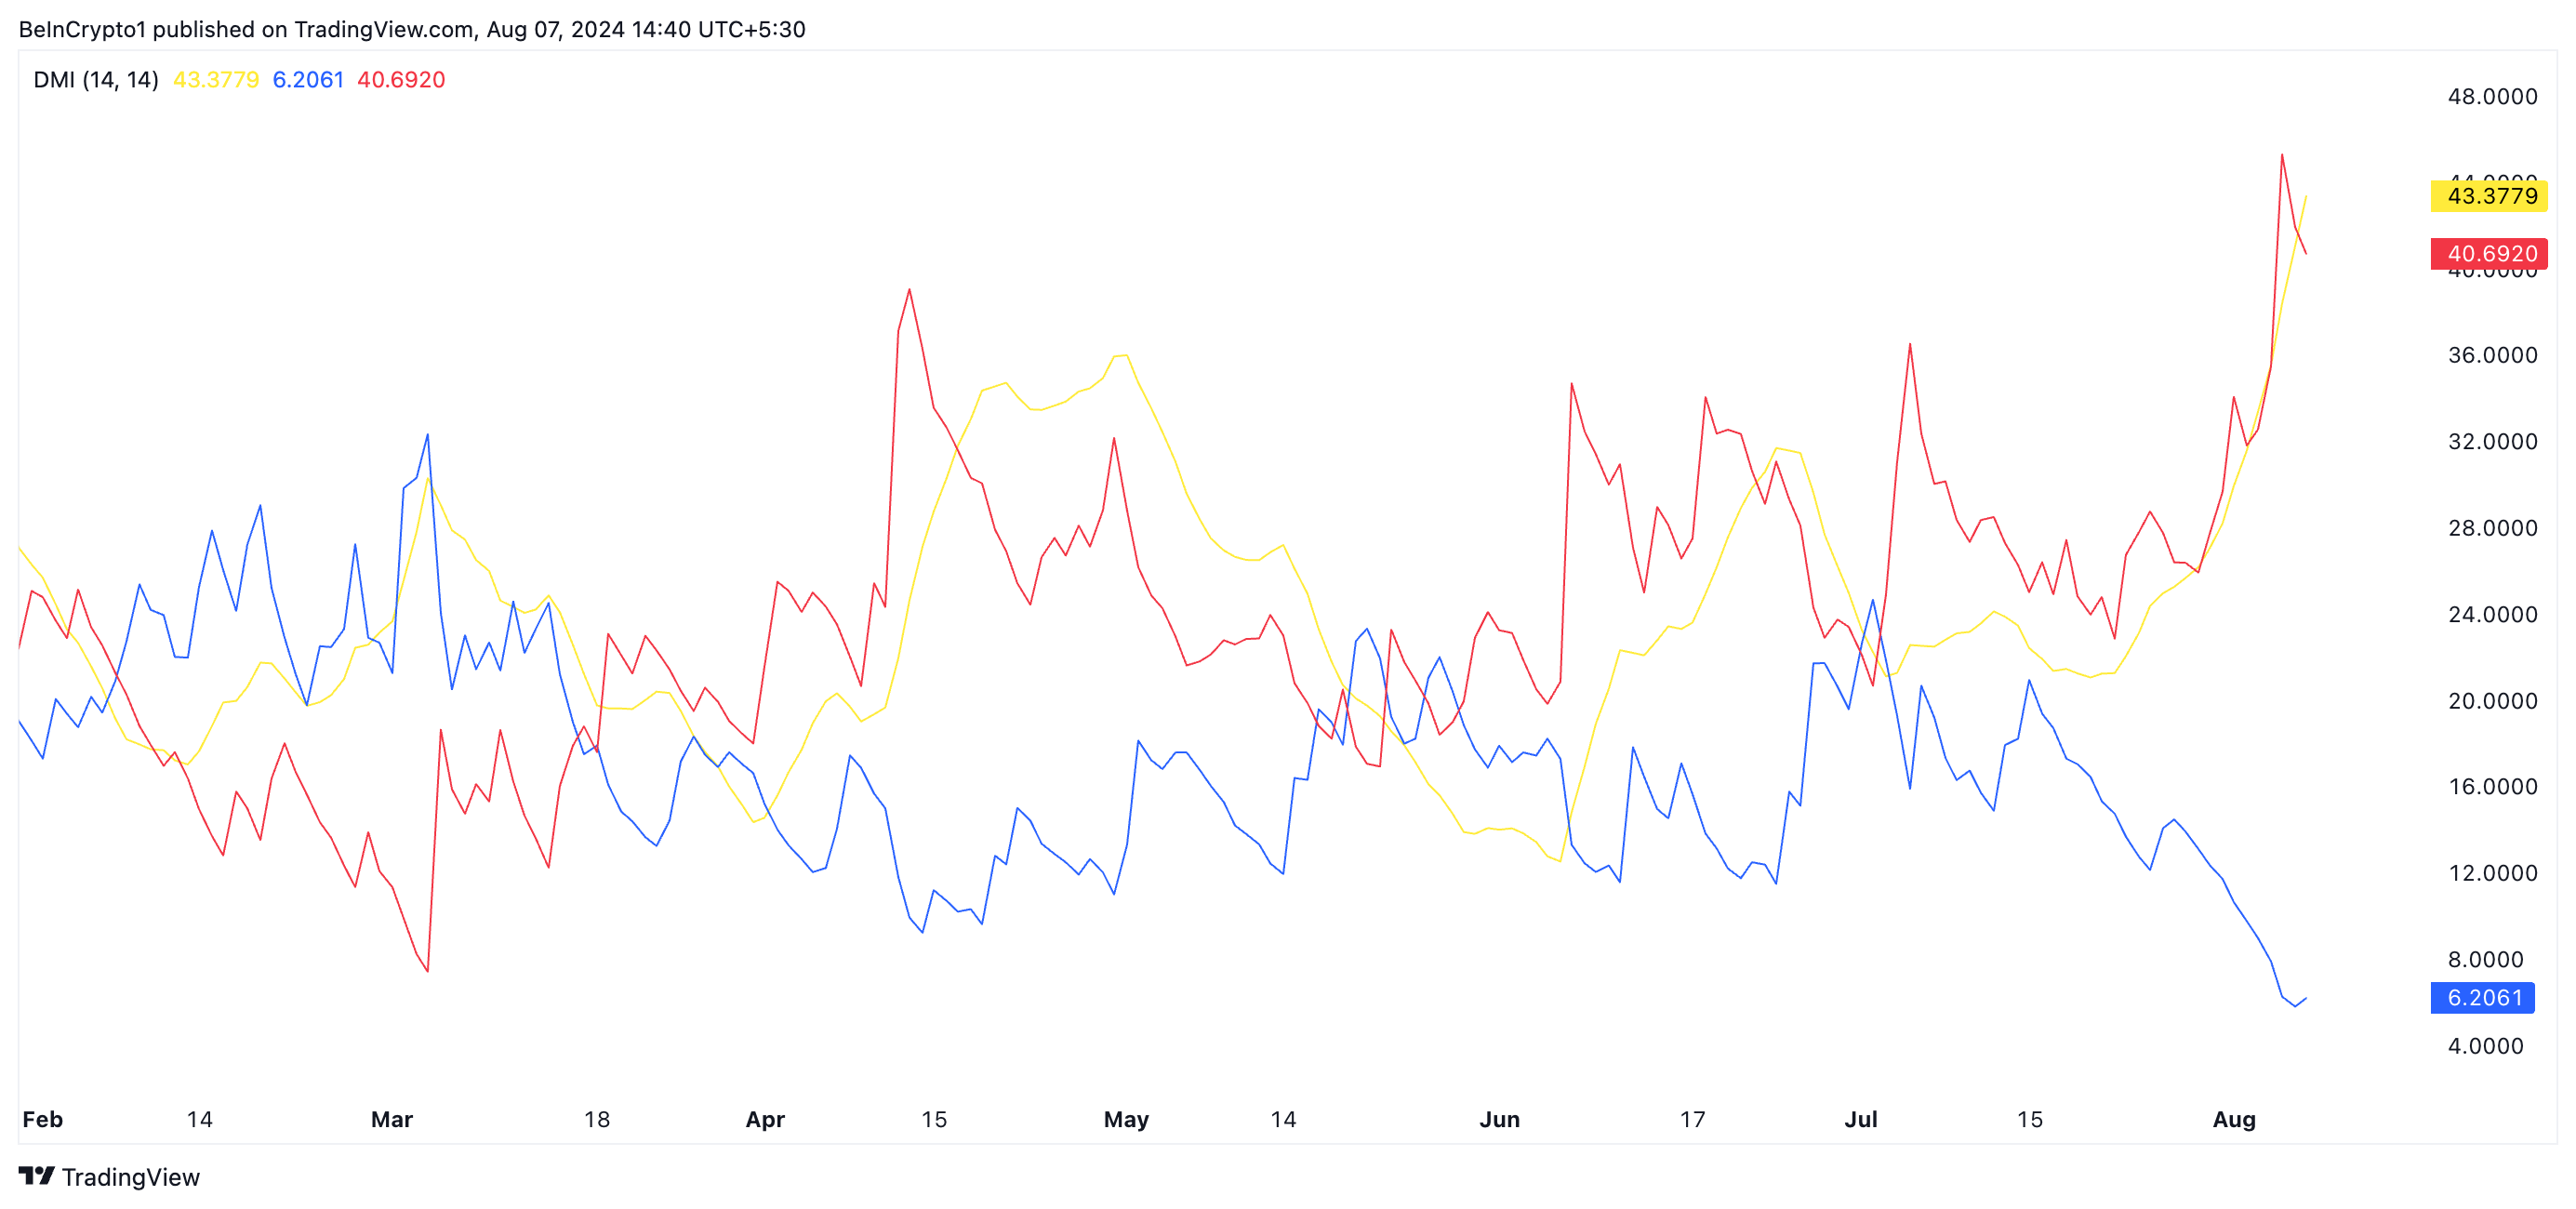 Polkadot Price Analysis. Source: TradingView
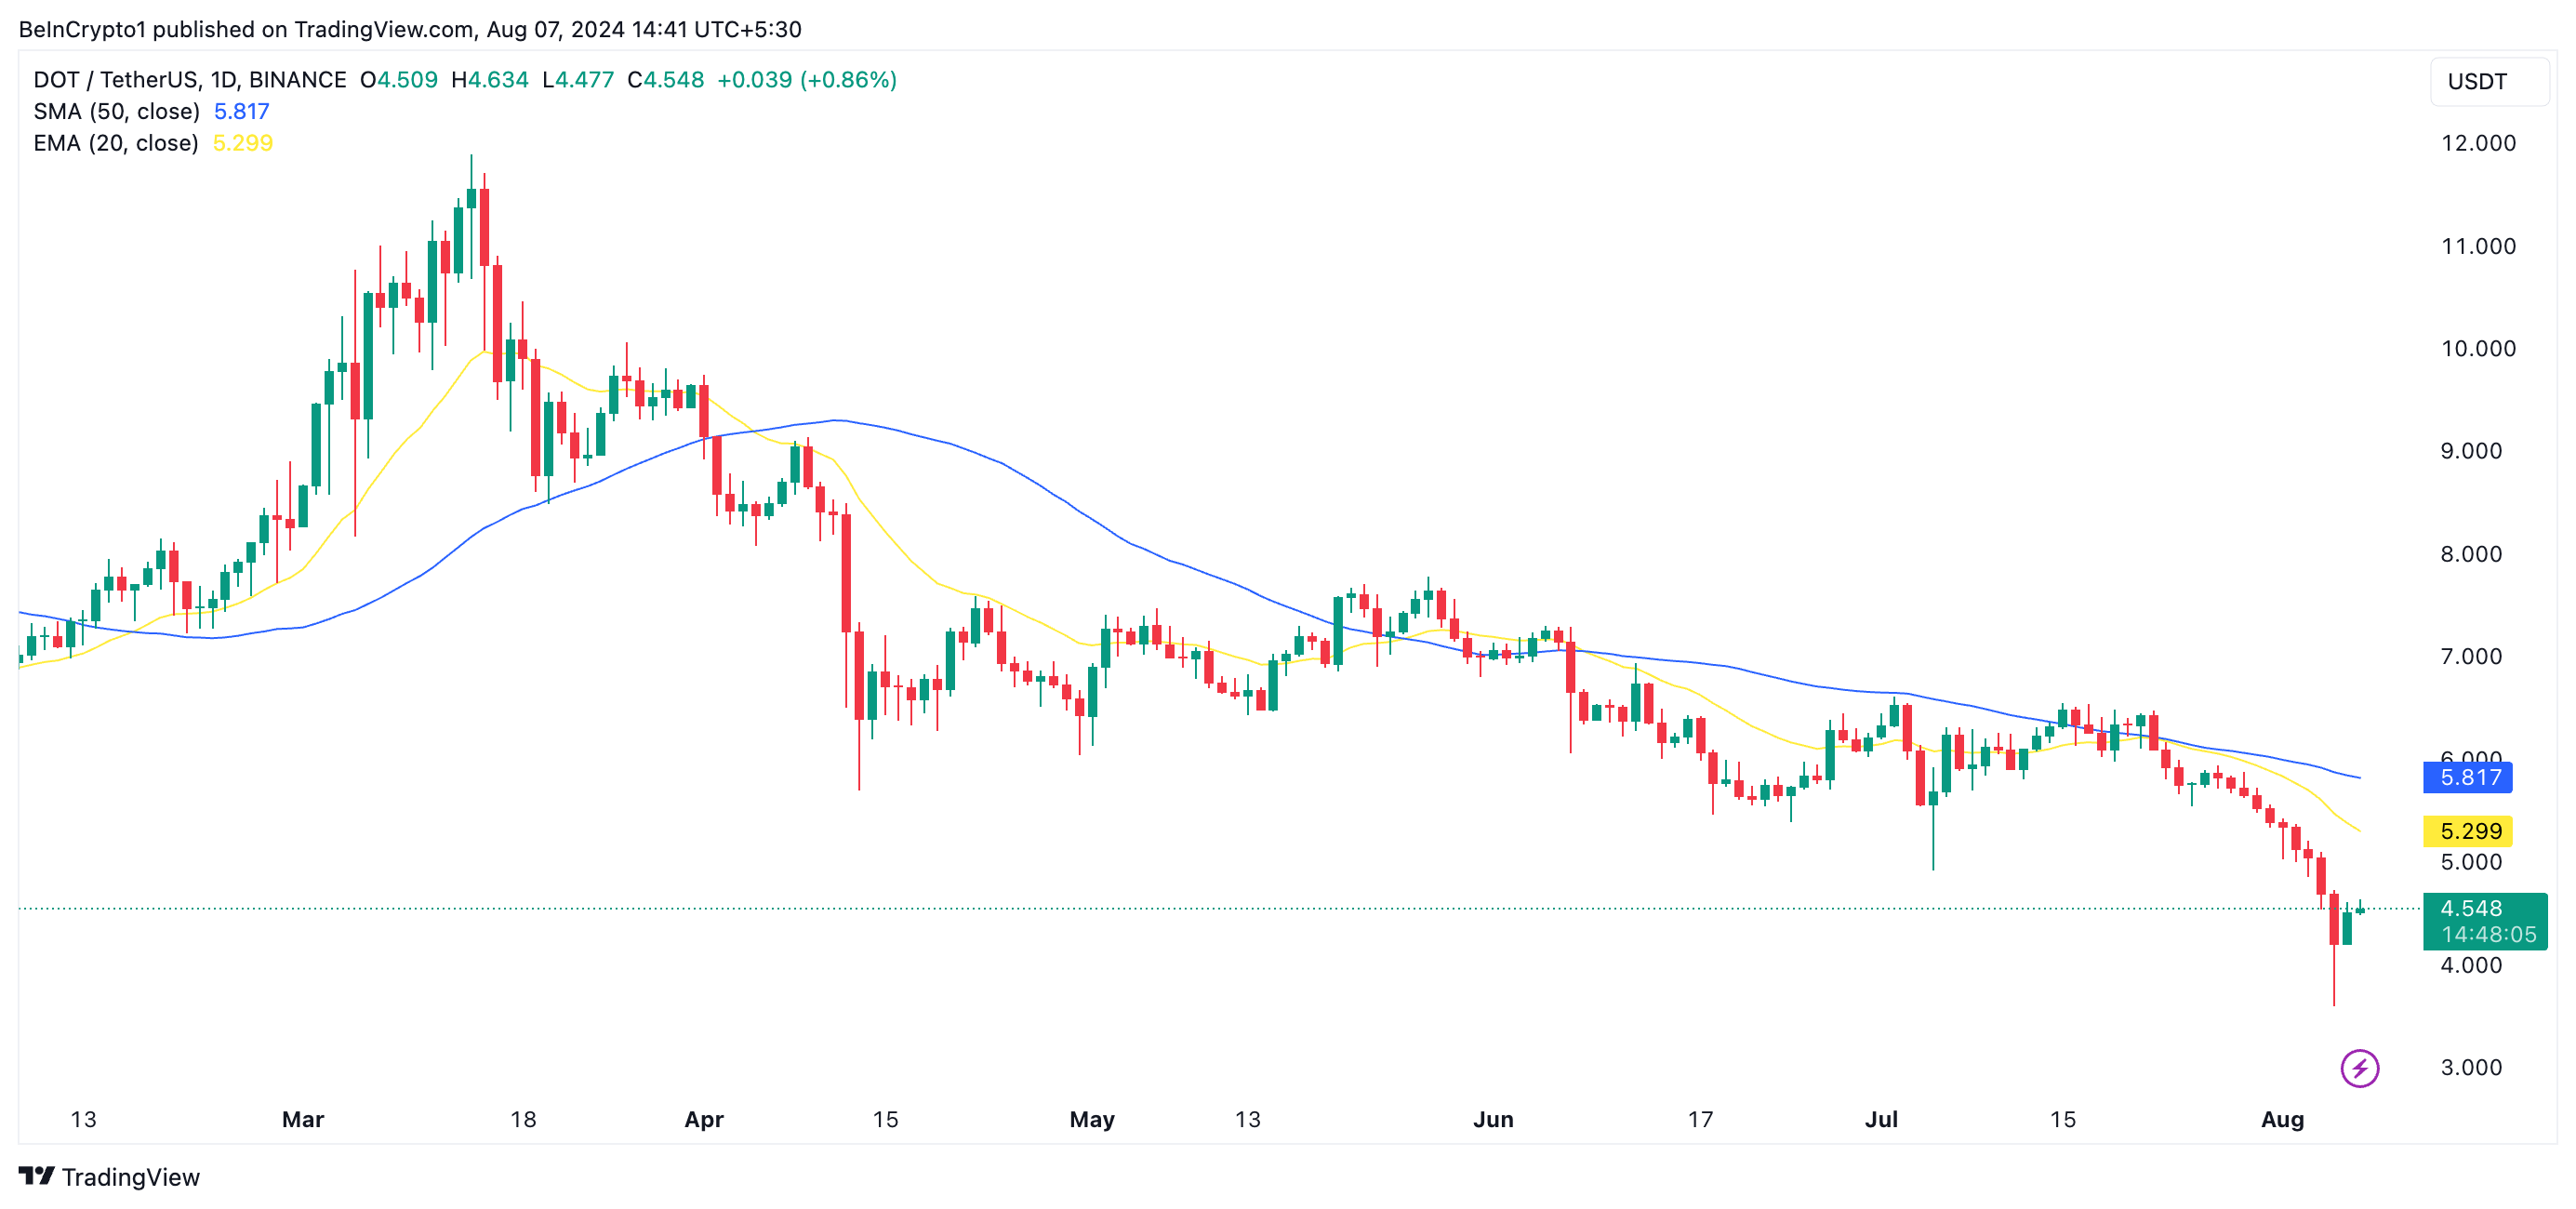
At press time, DOT trades below its 20-day exponential moving average (EMA) (yellow) and its 50-day small moving average (SMA) (blue).
An asset’s 20-day EMA is a short-term moving average that reacts quickly to price changes. It reflects the average closing price of an asset over the past 20 days. On the other hand, its 50-day SMA is a longer-term moving average that measures its average closing price over the past 50 days.
Read more: What Is Polkadot (DOT)?
 Polkadot Price Analysis. Source: TradingView
When an asset trades below these key moving averages, it is a bearish signal. It means that short-term and medium-term traders are selling the asset, leading to sustained downtrend pressure.
DOT Price Prediction: A Rally Above These Averages Is Important
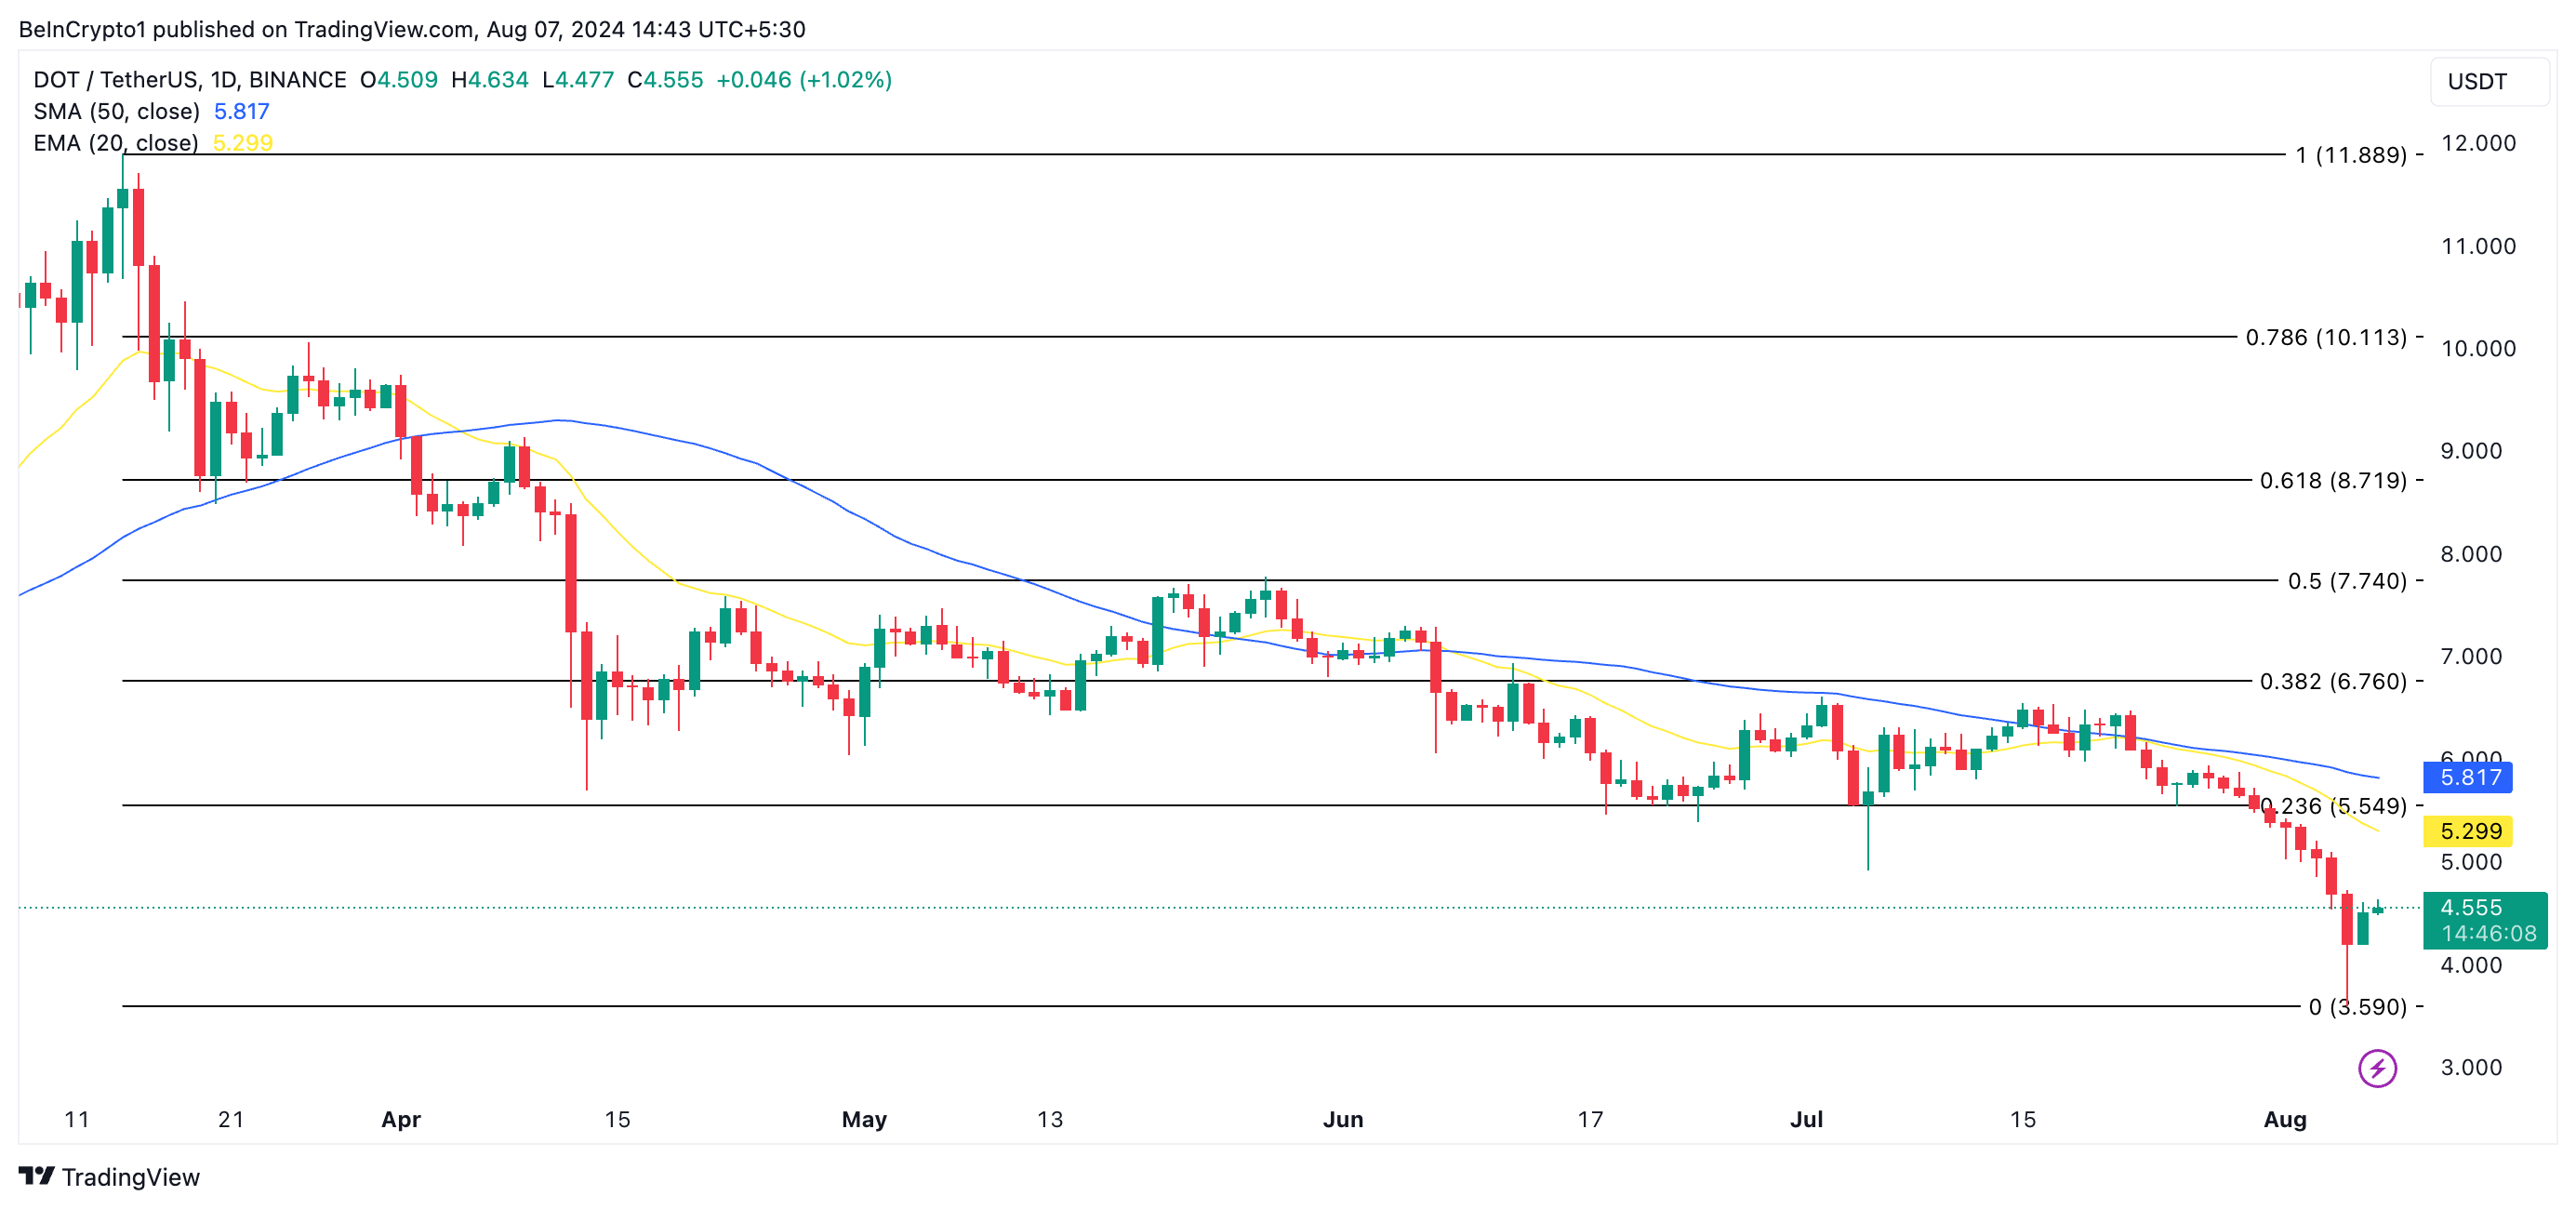
DOT’s 20-day EMA and 50-day SMA may act as resistance levels. If it tries to rally above them, it may face selling pressure around these averages and resume its downtrend. If this happens, DOT’s price may fall to the nine-month low of $3.59, which it traded at on Monday.
Read more: Polkadot (DOT) Price Prediction 2024/2025/2030
 Polkadot Price Analysis. Source: TradingView
However, if the coin initiates an uptrend and breaks above these moving averages, its price target will be $6.76.
1
0


 Manage all your crypto, NFT and DeFi from one place
Securely connect the portfolio you’re using to start.


0
0


0
0