
Pendle Price Prediction: Vault Hits 50M as Buybacks Accelerate

0
0
Pendle price prediction is turning heads after a sharp run higher. The token climbed hard while the protocol posted real activity numbers. Here's the thing: this isn't just another empty pump.
Something bigger sits under the surface. Steady deposit growth and a live buyback engine that feeds from fees. And that combo is rare right now.
But can the move keep going without a pause?
Why Pendle Price Is Moving Today
As per CoinMarketCap, demand accelerated after several strong sessions. Pendle rose from $1.325 on August 17 to $1.79 by August 24, 2026, around 12:18 UTC. Roughly a 49% climb. The 24-hour gain sits at 12.56%.
Trading volume reached $112.5 million. Market cap stands at $309.92 million. TVL holds at $3.68 billion. The circulating supply is 172.2 million out of 281.52 million total.
The real driver is the fee-to-buyback loop. Pendle sends 80% of V2 yield and swap fees into $PENDLE buybacks via a one-hour TWAP. Strong activity supports demand. Weaker periods leave the token more dependent on pure momentum.
And the latest product update adds fuel.
Key News Catalyst: Ecosystem USDC Vault Nears 50 Million
In just about 1.5 weeks the Pendle Ecosystem USDC vault pulled in nearly 50 million dollars.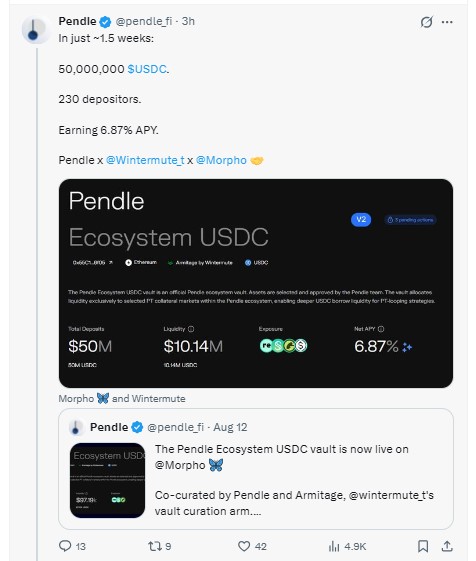
Total deposits sit at $49.83M. Liquidity is $9.8M. Net APY reads 7.41%. The vault went live on August 4, 2026, on Morpho and is co-curated with Wintermute.
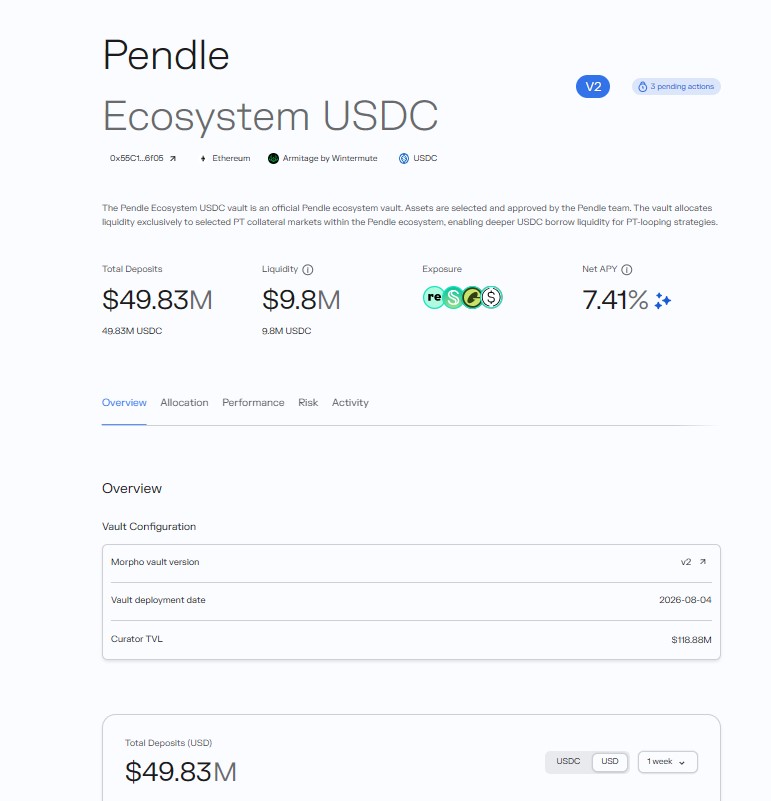
Allocation leans into PT-reUSD, PT-sUSDS, and PT-USDG markets. Vault Net APY is 6.04% plus a 1.37% PENDLE boost. Fees sit at zero right now.
This steady inflow feeds the fee engine. More fees mean more buybacks. That's the loop traders watch now.
$PENDLE Liquidation and Volume
Forced selling stayed limited so far.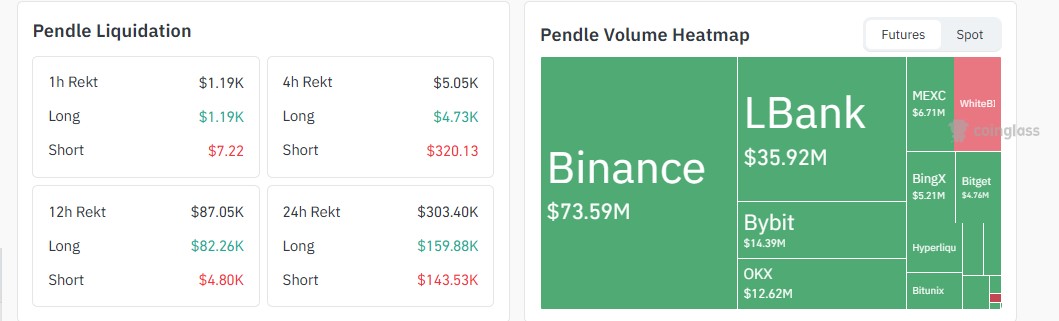
According to CoinGlass, 24h liquidation total: $303.40K. Longs took $159.88K. Shorts took $143.53K. The 12h window showed heavier long liquidations at $82.26K.
The volume heatmap shows Binance leading at $73.59M. LBank follows at $35.92M. Bybit at $14.39M. OKX at $12.62M.
The distribution suggests the rally hasn't triggered large-scale forced exits yet.
Pendle Technical Analysis and Chart Structure
$PENDLE Technical Analysis On Daily Timeframe
The daily chart on TradingView, the first thing that stood out, was the ascending channel breakout.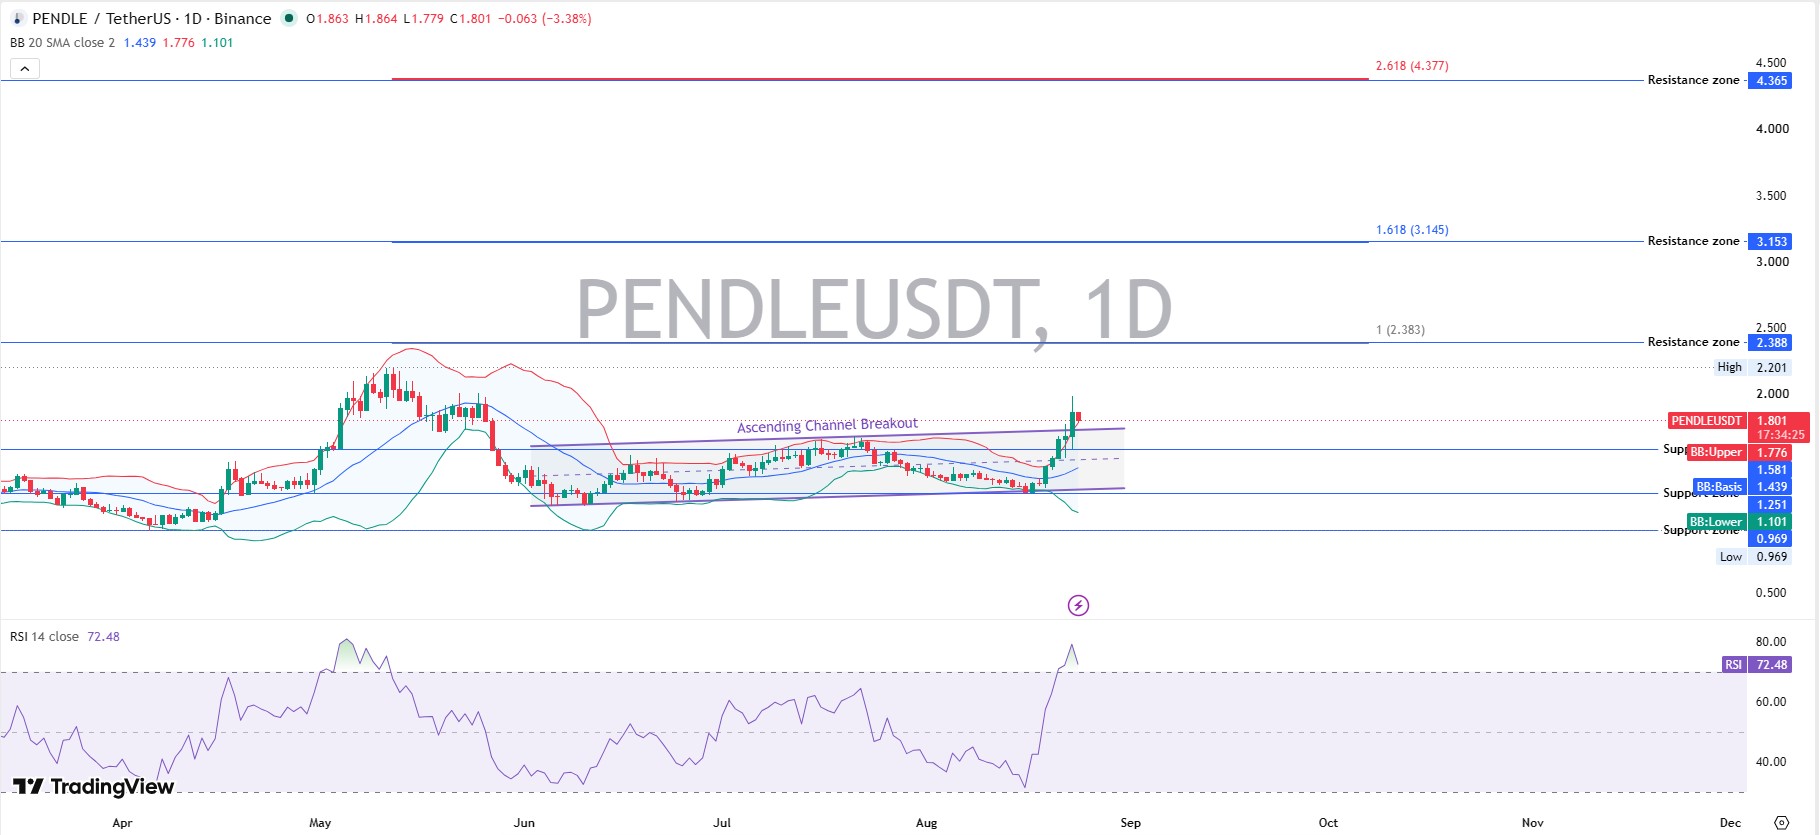
Price trades near $1.80 as of August 24, 2026, 12:18 UTC. It sits above the Bollinger Band upper line at $1.776. RSI 14 reads 72.48. That shows stretched short-term momentum.
Support zones mark $1.581, $1.439, $1.251, $1.101, and $0.969. Resistance zones sit at $2.388, $3.153, and $4.365. The recent high near $2.201 remains the first practical test.
Pendle Technical Analysis On Weekly Timeframe
On the weekly side, the long descending channel still frames the bigger picture.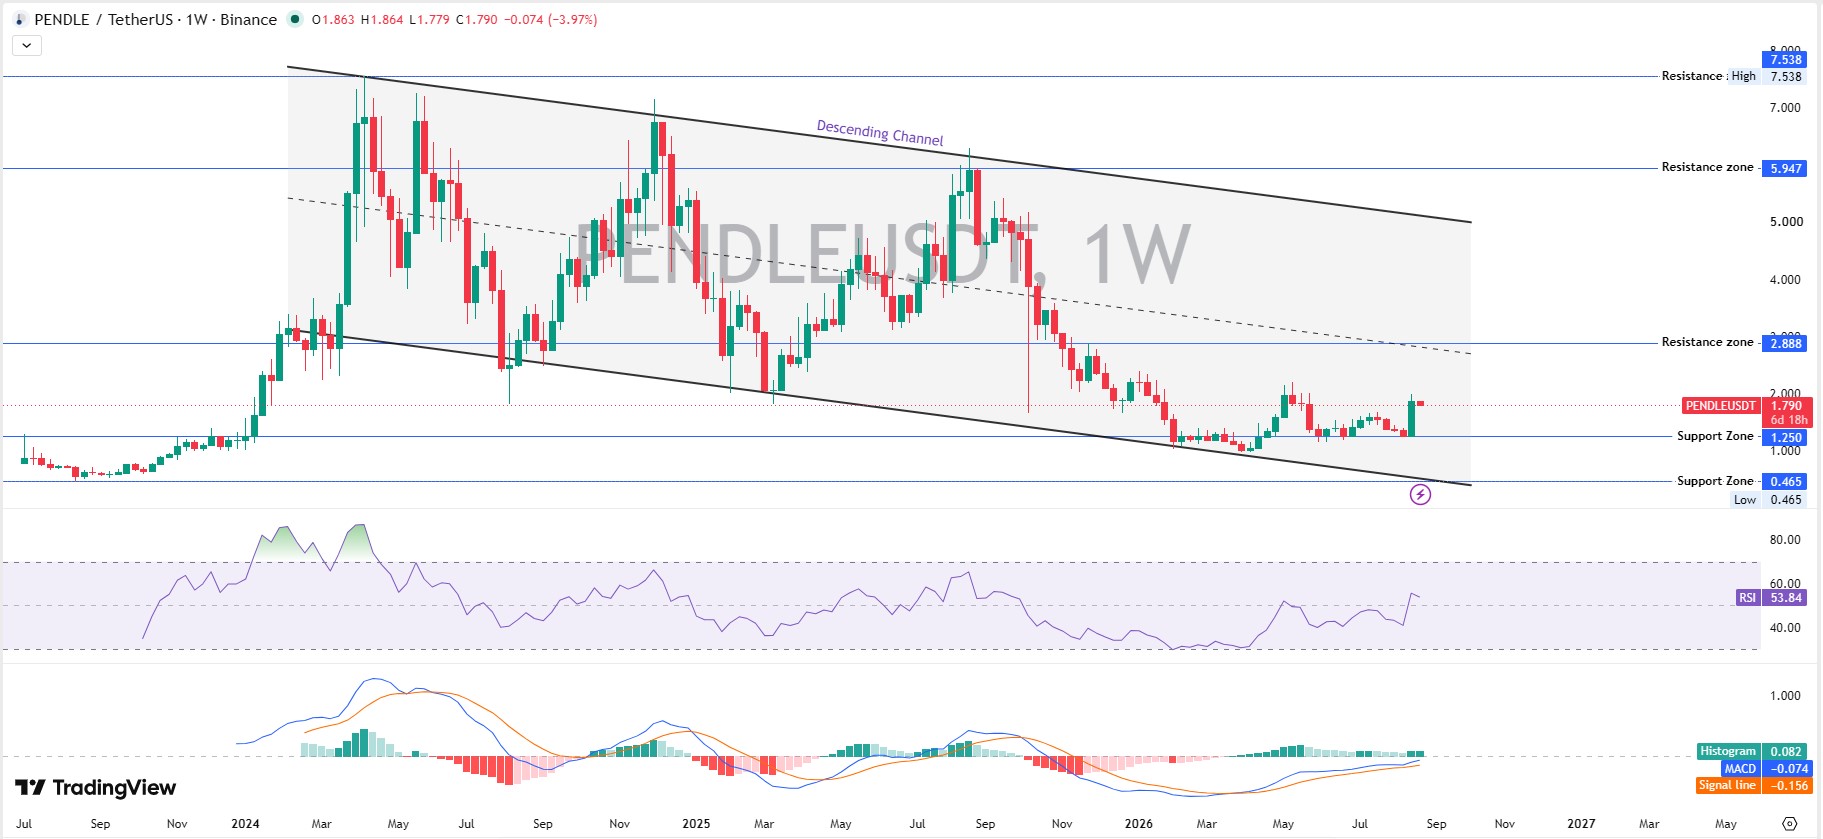
Price bounced near the lower channel boundary around the $1.25 support zone. Higher resistance zones sit at $2.888, $5.947, and the channel high near $7.538. Support zones mark $1.250 and the channel low at $0.465.
The $PENDLE price prediction stays constructive above $1.581. Buyers still control the short-term structure. A sustained move above $2.388 would open room toward $3.153. A break under $1.581 would force a more defensive view.
Weekly MACD shows a positive histogram at 0.082. The MACD line sits at -0.074 above the signal line at -0.156. That points to improving momentum on the higher timeframe even while price remains inside the descending channel.
$PENDLE Support and Resistance Levels
Support holds at $1.581 first. Then $1.251. Then $0.969.
Resistance starts at $2.20. Then $2.388. Higher targets sit at $3.153 and $4.365.
These levels come from recent swing points, the daily ascending channel, and the weekly descending channel. They matter because they mark where previous buyers and sellers stepped in.
$PENDLE Altcoin Analysis and Market View
Pendle sits in the altcoin yield-trading corner. It separates principal and future yield into PT and YT tokens that users can trade directly.
The protocol runs across Ethereum, Arbitrum, BNB Chain, Mantle, Optimism, Base, and several newer chains. That multi-chain footprint helps TVL stay sticky.
Unlike pure memecoins, Pendle has measurable product usage. TVL at $3.68 billion and the fee-linked buyback give it a clearer demand path.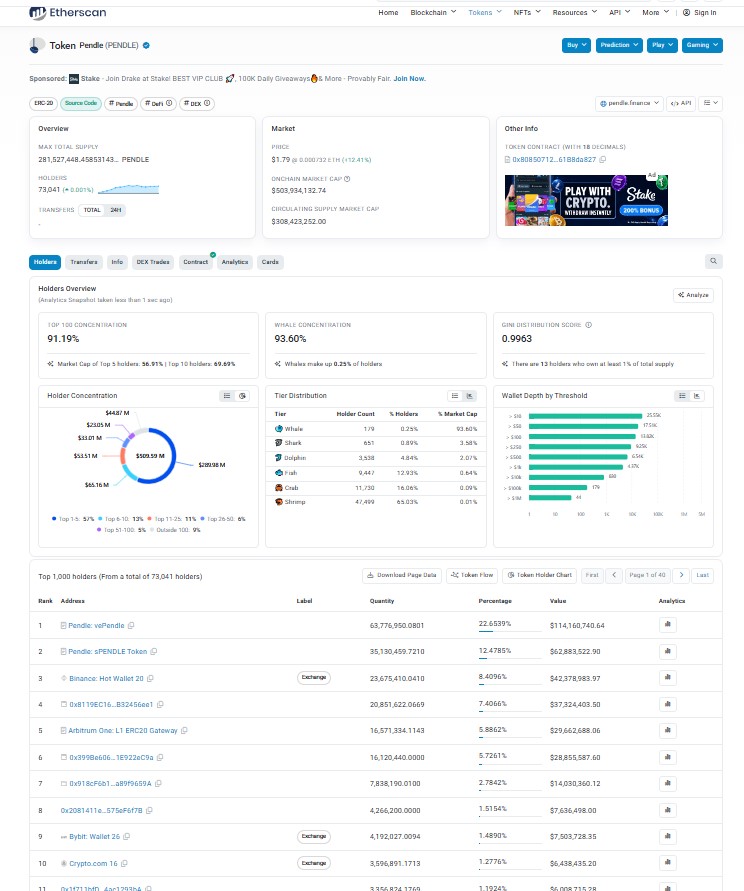
As per Etherscan, top-10 concentration sits at 91.19%. Whale concentration is 93.60%. The Gini score reads 0.9963. The largest holder is the vePENDLE contract. Exchange wallets also rank high. Large wallets can still swing the tape hard.
The all-time high remains $7.52 from April 2024. The all-time low sits at $0.03349 from November 2022.
Pendle Price Prediction: Bear Base and Bull Scenarios
Timeframe | Bear Case | Base Case | Bull Case | Probability | Invalidation |
7 Days | $1.58-1.70 | $2.20-2.38 | $2.38-2.60 | 25% / 50% / 25% | Below $1.581 |
30 Days | $1.25-1.58 | $2.38-3.15 | $3.15-3.60 | 25% / 50% / 25% | Below $1.251 |
Early 2027 | $0.97-1.50 | $3.15-4.37 | $4.37-5.50 | 30% / 45% / 25% | Below $0.969 |
The base case carries the most weight. Momentum is strong, and product metrics are improving. Yet short-term RSI is elevated, and $2.388 remains a clear hurdle.
A clean hold above $2.388 would tilt the probabilities higher. Failure at $1.581 would shift the map quickly.
What Could Happen Next for $PENDLE
If fee activity stays elevated, the buyback flow can keep supporting demand. The near-$50M vault is one data point. More product launches could add further interest.
But if broader altcoin sentiment cools, the token will feel it. High whale concentration means any large transfer can hit the tape fast.
Risks Traders Should Watch
Top-10 concentration near 91% and whale concentration near 93.6% remain the biggest structural risks. Future token distribution can also pressure valuation.
Stretched short-term momentum means pullbacks are normal. A break under $1.581 would weaken the current Pendle price prediction setup.
Disclaimer
This Pendle price prediction uses the supplied snapshots, chart levels, $PENDLE documentation, and market data available as of August 24, 2026, 12:18 UTC. Forecasts are scenarios, not guarantees, and can change with liquidity, protocol activity, token distribution, and wider crypto conditions. This is not financial advice. Verify data before trading.
0
0

 Manage all your crypto, NFT and DeFi from one place
Securely connect the portfolio you’re using to start.


