
Chainlink Price Prediction: LINK Eyes $8.64 Breakout

0
0

LINK is trading at $8.243, and something is happening on the chart that hasn't happened in weeks.
The same zone that rejected price five times in a row just got reclaimed, and now an ascending trendline is quietly lining up at the exact same spot.
This kind of double confirmation doesn't show up often, and when it does, it usually means one thing for the next move.
This Chainlink price prediction breaks down what that setup means, where the key levels sit, and what would flip this bullish structure invalid.
Chainlink Price Right Now
Metric | Value |
Price | $8.243 |
24h Change | +0.82% (+$0.06703) |
Market Cap | $6.16B |
Futures Volume (24h) | $254.00M |
Spot Volume (24h) | $38.01M |
Open Interest | $443.29M |
Circulating Supply | 748.09M LINK |
Total Supply | 1.00B LINK |
Max Supply | 1.00B LINK |
Source: CoinGlass, as of July 18, 2026
Market Context: How Bitcoin and Ethereum Are Shaping This Setup
Chainlink isn't moving in a bubble, so it helps to check what Bitcoin and Ethereum are doing too.
Bitcoin is trading near $63,913.53, up about 1.64% over the past day, and Ethereum is sitting near $1,843.16, up roughly 0.75%. Both are green today, even though the broader mood in the market hasn't fully caught up yet.
As per CoinMarketCap, the crypto fear and greed index reads 34 right now, which still falls under "fear" territory as of July 18, 2026.
That mismatch is actually what makes LINK's move worth paying attention to. Sentiment hasn't flipped positive yet, but the two biggest coins in the market are already climbing, and Chainlink managed to reclaim its key resistance zone right alongside them.
When price action starts improving before sentiment does, it's often a sign that buyers are getting ahead of the crowd rather than just reacting to hype after the fact.
Chainlink Liquidation Data today (18 july 2026)
According to CoinGlass, LINK liquidations have leaned toward longs on the shorter timeframes and toward shorts as the window widens. Over the past hour, $185.44 was liquidated, all from longs, with no shorts wiped out. 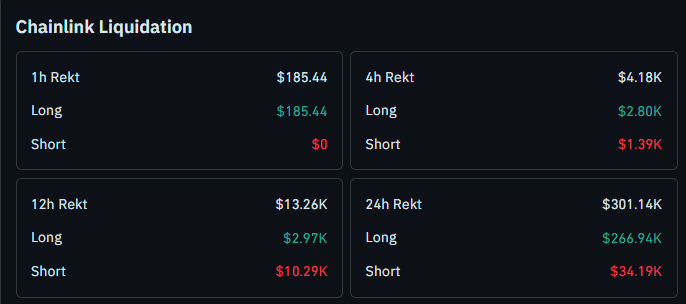
The 4-hour window shows $4.18K in total liquidations, with $2.80K from longs and $1.39K from shorts. Over 12 hours, that climbs to $13.26K, made up of $2.97K in longs and $10.29K in shorts.
Across the full 24 hours, liquidations total $301.14K, with longs accounting for $266.94K and shorts for $34.19K.
The larger share of long liquidations over the full day lines up with the earlier chop near the flip zone, while the more recent short liquidations support the idea that sellers got caught off guard once LINK held its ground.
Why Is Chainlink Price Rising Today?
A few things are lining up at once for LINK right now:
Flip zone reclaim: After five failed attempts, LINK has broken and closed above the $8.099 to $8.137 zone, turning old resistance into fresh support.
Trendline confluence: An ascending trendline built from the recent higher lows is arriving at almost the exact same price zone, reinforcing the level from a second angle.
Short-side liquidations: Data from CoinGlass shows short positions have started taking losses over the past several hours as price refused to roll over, which tends to add extra upward pressure as those positions get closed out.
ETF inflow activity: LINK spot ETF products have logged a cumulative net inflow of $125.15K as of July 17, 2026, including a standout weekly inflow of $915.20K during the week of July 2, pointing to steady, if uneven, institutional interest.
Chainlink Price Prediction: Chart Analysis (Short-Term Outlook)
Methodology note: This reading uses the 1-hour LINK/USDT chart on Binance via TradingView, combining price structure with RSI for momentum confirmation. Levels are invalidated only on a confirmed candle close beyond the stated trigger, not an intraday wick.
The $8.099 to $8.137 range on the LINK chart is a textbook flip zone, a level that keeps switching roles between support and resistance. 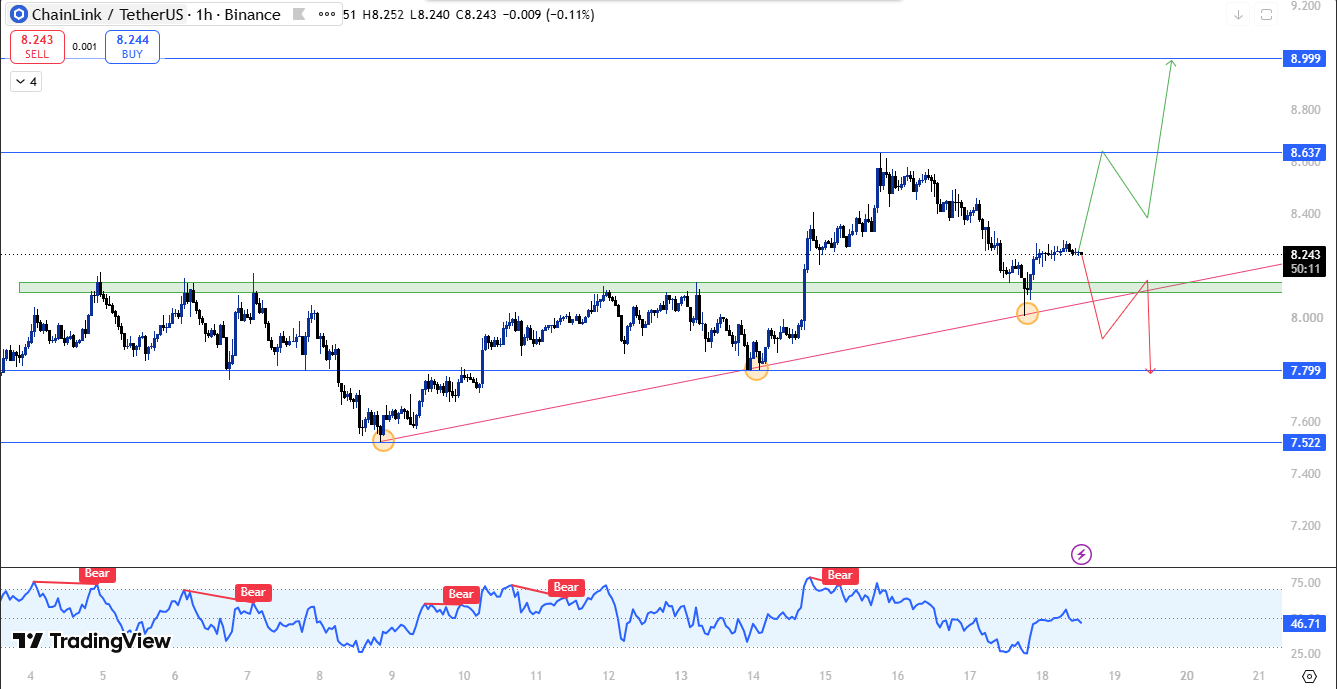
Price tested this zone as resistance five separate times over the past couple of weeks, getting rejected on every attempt. Then, with a sudden burst of momentum, LINK finally broke straight through it.
What makes the current setup stand out is what happened next. Instead of pulling back and losing the level the way it had after every prior test, LINK came back down, touched the same flip zone from above, and held. That is now acting as fresh support.
Adding weight to this is an ascending trendline, a rising line connecting a series of higher lows, that has been quietly supporting price on the way up.
Right now, that trendline and the flip zone are overlapping at almost the same spot.
This kind of double confirmation, where a horizontal support zone and a trendline meet at the same price, doesn't happen often, and when it does, it tends to draw in more buyers looking for a clean entry.
It's worth noting how strong the reaction was the last time the price tapped this trend line.
On the second touch, LINK staged a sharp recovery moving from the low seven-dollar range back up toward the recent highs near $8.637.
That kind of reaction shows real buying interest sitting along this trendline.
On the momentum side, RSI is currently reading 46.71, a modest recovery after touching bearish territory during the last rejection near the highs.
It's not yet in strongly bullish territory, but it has climbed off its recent lows, which fits with the idea that pressure is easing rather than building.
If LINK continues to hold above the $8.099 to $8.137 zone, the next resistance levels to watch sit at $8.637, followed by $8.999.
On the other hand, if this zone fails to hold and the price closes below $7.799, that would break the current bullish structure and open the door toward $7.522 next.
Chainlink Technical Snapshot
Indicator | Signal |
Trend | Bullish above flip zone |
RSI | 46.71, recovering |
Structure | Flip area reclaim + trendline confluence |
Liquidations | Shorts getting squeezed on shorter timeframes |
ETF Flows | Net positive cumulative inflow |
$LINK Support and Resistance Levels
Type | Level | Note |
Resistance 2 | $8.999 | Next major upside target |
Resistance 1 | $8.637 | Immediate resistance |
Current Price | $8.243 | Trading above flip zone |
Flip Zone / Support 1 | $8.099 - $8.137 | Reclaimed after five failed resistance tests |
Support 2 | $7.799 | Invalidation trigger on a confirmed close below |
Support 3 | $7.522 | Deeper downside support |
Risk-Reward Table
Case | Trigger | Target |
Bull Case | Holds the $8.099 to $8.137 flip zone with trendline support intact | Move toward $8.637 and $8.999 |
Bear Case | Confirmed close below $7.799 | Slide toward $7.522 |
Invalidation Level
For this bullish view on LINK to keep working, the $8.099 to $8.137 flip zone needs to hold, and the rising trendline needs to stay intact underneath it.
If LINK closes below $7.799 on the 1-hour chart, that breaks the setup completely, and the next thing on the radar becomes $7.522 on the downside.
Historical Context
What makes this move worth paying attention to is that it's the first time LINK has actually managed to hold above this flip zone after failing here five times in a row.
Every earlier attempt ended the same way: price would poke through and then get pushed straight back down.
This time it didn't happen, and that alone tells you something may have shifted in who's in control of this trend.
Chainlink Glossary
Flip Zone: A price area that keeps switching sides, sometimes acting as support, sometimes as resistance, depending on which way price is coming from.
RSI (Relative Strength Index): A simple indicator that shows whether an asset has been moving too fast in one direction, helping traders spot when something might be overbought or oversold.
Open Interest: The total value of derivative positions like futures that are still open and haven't been closed out yet.
Liquidation: What happens when a leveraged trade gets forcibly closed because the trader ran out of margin to keep it open.
Ascending Trendline: A line drawn along a series of rising lows, often used to track where buyers keep stepping in.
Fear and Greed Index: A daily gauge of whether crypto traders are feeling fearful or greedy, based on price swings, volume, and overall market mood.
Expert View
Chainlink getting back above the $8.099 to $8.137 zone means more this time than it would have on any of the earlier attempts, simply because of how many times the price failed here before.
On top of that, there's a rising trendline sitting almost exactly where this flip zone is, and having two separate signals line up like this at the same spot doesn't happen too often.
When it does, it usually pulls in more buyers who are looking for a cleaner place to enter.
Add in the fact that short sellers have been getting squeezed lately and LINK's ETF numbers have stayed net positive, and the short-term picture leans toward a push up to $8.637 and possibly $8.999 as long as this zone keeps holding.
If LINK ends up closing below $7.799, though, that would be the clearest sign that this setup didn't work out.
Disclaimer: This article is for informational purposes only and should not be considered financial advice. Cryptocurrency markets are highly volatile, and price predictions are not guaranteed. Please do your own research before making any investment decisions.
0
0

 Manage all your crypto, NFT and DeFi from one place
Securely connect the portfolio you’re using to start.

0
0

0
0


0
0