
Litecoin Price Prediction 2026–2030: Can LTC Hit $100 Soon?

0
0

What to Know
- Litecoin trades near $67.84 following a 15.65% weekly gain, with buyers testing resistance around $67.65 as trading activity rises.
- Grayscale’s proposed trust conversion has renewed ETF interest, while rising open interest and short liquidations have accompanied LTC’s advance.
- Holding $61.68 could support a move toward $75.28, whereas a breakdown would put the $54.52 Supertrend level in view.
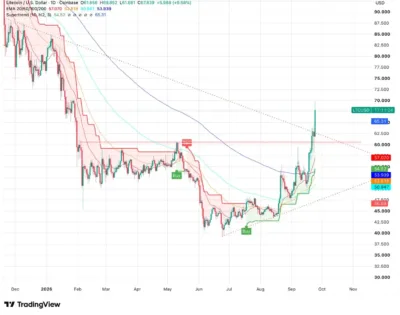
Litecoin (LTC) trades near $67.84, up 9.68% on the day and 15.65% for the week, as buyers test a resistance area around $67.65 following a breakout above the $60 level that had capped recoveries since April. Grayscale’s application to convert its Litecoin Trust into a spot ETF has added to market interest, although approval remains uncertain.
The daily chart shows a Supertrend buy signal at $54.52, while the weekly chart places LTC above its Bull Market Support Band between $49.43 and $53.22. Derivatives activity has also increased, with 24-hour volume reaching $1.25 billion and open interest rising to $609.90 million.
Also Read: Phala Network Price Prediction 2026–2030: Can PHA Hit $0.10 Soon?
Litecoin Breaks Above a Longstanding Barrier
LTC’s move through $60 gives buyers a level to defend following several months in which rallies struggled to hold above it. A sustained position above $61.68 would strengthen the case for further gains, particularly if buyers can establish support around the current resistance area.
However, trading near $67.65 leaves little room for a weak breakout. If LTC retreats below $61.68, the move above $60 could lose momentum, bringing the daily Supertrend level at $54.52 back into view.
ETF Interest and Derivatives Activity
Grayscale filed an amendment with the SEC on September 11 seeking to convert its Litecoin Trust into a spot ETF listed on NYSE Arca. Canary Capital’s LTCC already provides listed spot ETF exposure to Litecoin, although its reported net inflow was zero on September 23, following small inflows and outflows over the preceding two sessions.
According to the figures provided, LTCC had cumulative net inflows of $10.43 million and total net assets of $8.32 million. Grayscale’s filing may broaden regulated access if approved, but the application alone does not guarantee demand for LTC.
Meanwhile, LTC derivatives volume rose 71.20% to $1.25 billion over 24 hours, and open interest climbed 8.82% to $609.90 million. Short positions accounted for $436,200 of the $547,930 liquidated over the reported four-hour period, suggesting that traders betting against the rally absorbed most of the losses.
Technical Outlook
The immediate test is whether LTC can hold above $67.65 and build on its break through $60. If buying remains strong, the supplied chart identifies $75.28 as the next upside level, followed by $85.
Conversely, a retreat below $61.68 would weaken the near-term setup and expose $54.52. The weekly support band between $49.43 and $53.22 would become relevant if the decline deepens, making it an important area for assessing whether the broader recovery remains intact.
Source: Tradingview
Can Litecoin Reach $100?
Litecoin could reach $100 under a sustained bullish scenario, but it would first need to clear $67.65, advance through $75.28 and overcome the $85 resistance area. From the quoted price near $67.84, a move to $100 would require a gain of roughly 47%.
ETF developments could influence sentiment, while stronger spot demand would help determine whether a rally supported by derivatives activity can last. If LTC instead falls below $61.68 and $54.52, the path to $100 would become less convincing.
Litecoin Price Prediction (2026–2030)
| Year | Minimum | Average | Maximum |
|---|---|---|---|
| 2026 | $49 | $70 | $100 |
| 2027 | $45 | $85 | $130 |
| 2028 | $55 | $105 | $165 |
| 2029 | $65 | $125 | $200 |
| 2030 | $75 | $150 | $250 |
Price Forecast by Year
2026
LTC could trade between $49 and $100 if buyers defend the weekly support band and eventually clear resistance at $75.28 and $85. A drop below $61.68 would make the lower portion of that range more relevant, while progress toward $100 would require a sustained recovery beyond the levels visible on the current chart.
2027
A favorable market and stronger demand for regulated Litecoin products could support a move toward $130. However, ETF approval or availability would not, by itself, establish that investors will buy enough LTC to sustain higher prices.
2028
If Litecoin builds a sequence of higher lows and holds above former resistance levels, the bullish scenario places its upper range near $165. Weaker participation or a broader market downturn could instead keep LTC closer to the projected $55 minimum.
2029
A sustained advance could bring $200 into view, provided LTC preserves earlier gains and attracts enough demand to support higher valuations. Failure to maintain its longer-term trend would leave the lower end of the $65–$200 scenario more plausible.
2030
The upper scenario reaches $250 by 2030, while the illustrative average stands at $150. Both figures depend on developments that cannot be established from the present breakout, including future market conditions and sustained demand for Litecoin.
Conclusion
Litecoin’s move above $60, its daily Supertrend buy signal and rising derivatives activity support a bullish near-term outlook, with $67.65 serving as the immediate test. A sustained breakout could bring $75.28 and $85 into view before buyers can make a credible attempt at $100.
However, losing $61.68 would weaken the recovery and shift attention toward $54.52, followed by the weekly support band around $49.43–$53.22. Grayscale’s pending ETF application may influence sentiment, but LTC’s ability to hold its breakout remains the more immediate price signal.
FAQs
1. Is Litecoin currently bullish?
LTC’s break above $60 and its daily Supertrend buy signal support a bullish near-term reading, although buyers still need to hold their gains around $67.65.
2. What is Litecoin’s immediate resistance?
The supplied chart places immediate resistance near $67.65, followed by upside levels at $75.28 and $85.
3. What support levels should traders watch?
The nearest support is $61.68, followed by the Supertrend level at $54.52 and the weekly support band between $49.43 and $53.22.
4. Can Litecoin reach $100?
LTC could reach $100 if it sustains its breakout and clears $75.28 and $85, although that outcome remains a scenario rather than a confirmed forecast.
Also Read: Bedrock Price Prediction 2026–2030: Can BR Hit $2 Soon?
The post Litecoin Price Prediction 2026–2030: Can LTC Hit $100 Soon? appeared first on 36Crypto.
0
0

 Manage all your crypto, NFT and DeFi from one place
Securely connect the portfolio you’re using to start.


