
Dogecoin Price Prediction September 2026: DOGE 600% Outlook

0
0

Dogecoin started out in December 2013 as a joke, a Shiba Inu meme bolted onto a Litecoin fork, and somehow it never left.
Over a decade later it's still one of the most traded assets in crypto, propped up equally by community loyalty, meme culture, and the occasional Elon Musk tweet.
$DOGE is currently trading at $0.09196, up modestly on the day.
Anyone searching for a dogecoin price prediction September 2026 today is really asking one question: does the coin's meme staying power translate into another leg up, or is this just noise before the next drawdown?
This dogecoin price prediction September 2026 breakdown works through both the chart and the fundamentals to answer that.
Price Today: Live Data and 24-Hour Change
Metric | Value |
Price | $0.09196 |
24H Change | +0.5% |
24H Range | $0.08836 - $0.0933 |
Market Cap | $14.315B |
Fully Diluted Valuation | $14.315B |
24H Trading Volume | $1.148B |
Circulating Supply | 155.632B |
Total Supply | 155.634B |
Max Supply | Unlimited |
Total Treasury Holding | 805,037,540 |
Source: MarketCap data taken from Coingecko, data as of Aug 25, 2026. Figures may vary slightly across other tracking websites.
Key Takeaways
DOGE trades at $0.09196, up 0.5% on the day but down 3.9% against Bitcoin.
The daily chart shows a completed trendline breakout out of a demand zone, with price now retesting that breakout shelf.
The weekly chart is a descending triangle, and this week's candle is testing its upper boundary.
A confirmed weekly breakout opens a long-term path toward the $0.30 to $0.48 zone, a multi-year scenario, not a September call.
Daily RSI sits at 76.40, well above the 61.58 moving average, so the setup is stretched.
Our dogecoin price prediction September 2026 leans cautiously constructive above $0.0888, with a clear bearish flip below it.
Daily Chart Structure
Zoom into the daily, and the story is clean. Price spent weeks grinding below a descending trendline, and every bounce that touched it got sold straight back down textbook rejection.
Eventually the selling exhausted itself, and the price carved out a demand zone right under the trendline, a coiled spring. 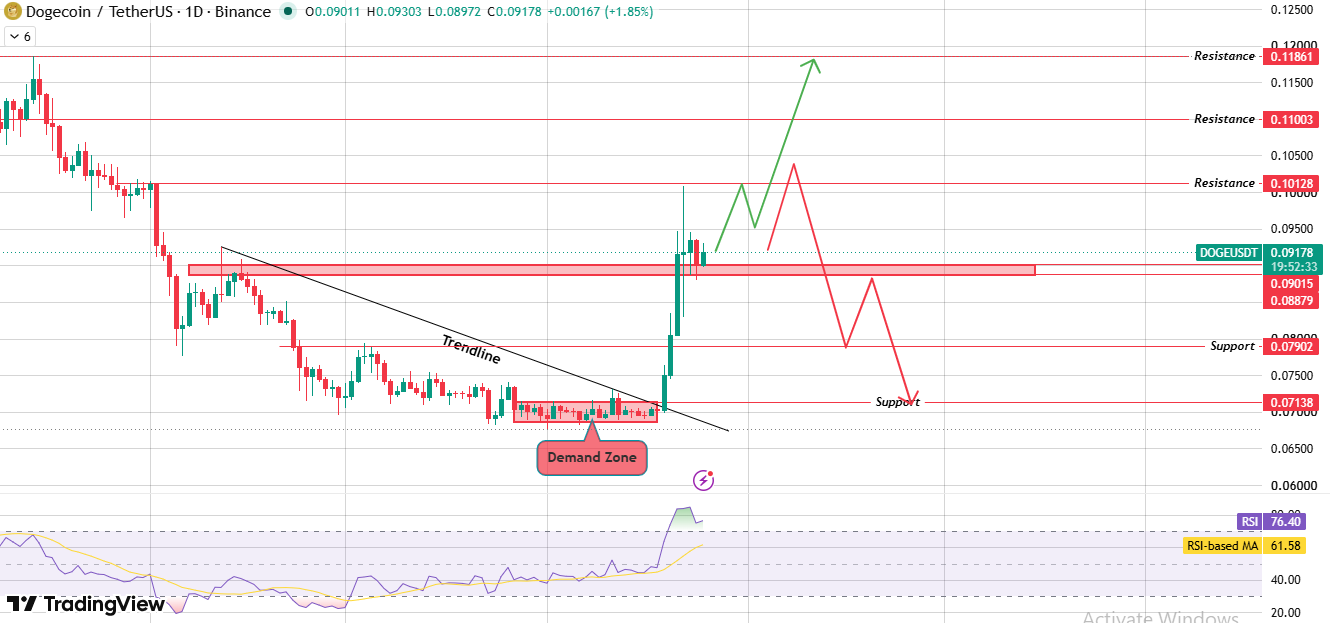
Source: Daily Chart Taken From TradingView.
When the breakout came, it came hard; $DOGE ripped through the trendline and didn't stop until it hit the $0.09 to $0.093 area.
Right now the price is retesting that old resistance-turned-support shelf.
Hold this zone with real volume, and the next leg levels the resistance stack above. Lose it, and the breakout gets invalidated fast.
Weekly Chart Structure
Step back to the weekly, and a bigger pattern shows up, a descending triangle compressing since the last cycle top.
The upper boundary is a falling trendline, the lower boundary a flat support line near $0.0686. 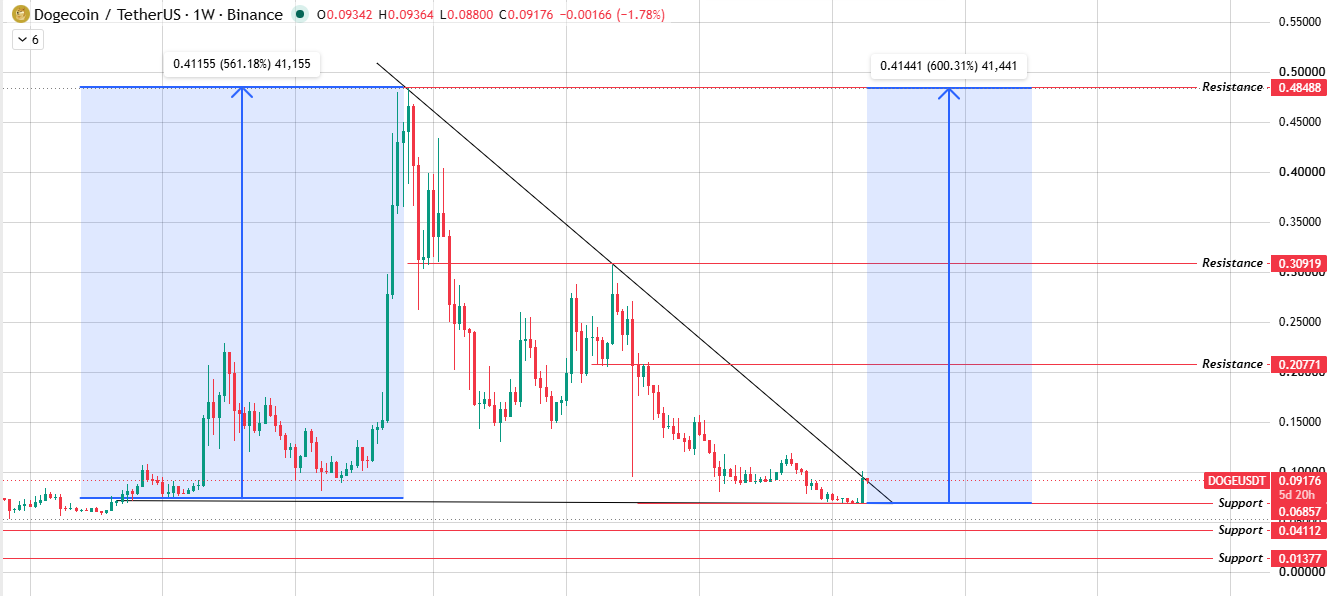
Source: Daily Chart Taken From TradingView.
This week's candle is pressing directly against that trendline. If it closes above and confirms, the measured structure points toward a much larger move, one that historically would carry price toward the $0.30 to $0.48 region over a longer horizon.
That's not a September target; it's a pattern-implied ceiling if the breakout sticks over multiple weeks.
RSI and Momentum
Daily RSI reads 76.40 against a moving average of 61.58. That's overbought by most conventional readings, and it lines up with how sharp the recent bounce off the demand zone was.
Overbought doesn't automatically mean reversal; trends can stay overbought for a while during genuine breakouts, but it does raise the odds of a pause or a pullback into support before any fresh push higher.
Technical Analysis: Key Support and Resistance
Daily Chart Levels
Level Type | Price |
Resistance 3 | $0.11861 |
Resistance 2 | $0.11003 |
Resistance 1 | $0.10128 |
Current Retest Zone | $0.08879 - $0.09015 |
Support 1 | $0.07902 |
Support 2 | $0.07138 |
Weekly Chart Levels
Level Type | Price |
Resistance 3 | $0.48488 |
Resistance 2 | $0.30919 |
Resistance 1 | $0.20771 |
Support 1 | $0.06857 |
Support 2 | $0.04112 |
Support 3 | $0.01377 |
The daily levels are the ones that matter for a September call, tight, close to the current price, and directly tied to the trendline breakout and retest already in play.
The weekly levels are a different animal entirely; they come from the descending triangle's broader structure and only become relevant if that pattern confirms a breakout over several weeks, which pushes their relevance out toward the 2027 to 2030 window covered later in this piece.
Dogecoin Price Prediction September 2026: Bull, Base, and Bear Cases
Short-Term (Daily Chart, September 2026)
Scenario | Levels | Setup | Invalidation |
Bull | $0.10128 - $0.11861 | Daily trendline breakout holds, volume expands, and price clears the retest zone and pushes through resistance in sequence. | Daily close below $0.08879 |
Base | $0.0900 - $0.10128 | Price chops sideways inside the reclaimed demand-to-resistance range while the market waits for a volume trigger. | Extended stay outside this band in either direction |
Bear | $0.07902 - $0.07138 | Resistance rejection near $0.10128 combined with a breakdown of the current support retest zone | Reclaim and daily close above $0.09015 |
Long-Term (Weekly Chart, 2027 to 2030)
Scenario | Levels | Setup | Invalidation |
Bull | $0.30919 - $0.48488 | Weekly candles close and hold above the descending triangle's upper trendline, confirming a multi-year breakout. | Weekly close back inside the triangle, below the trendline |
Base | $0.06857 - $0.20771 | Price stays trapped inside the triangle, oscillating between its support floor and the falling trendline for an extended stretch. | Extended sideways compression without a confirmed close on either side |
Bear | $0.04112 - $0.01377 | Triangle support at $0.06857 breaks down, and the pattern resolves lower instead of higher. | Reclaim and weekly close above $0.06857 |
The short-term table is what actually applies to a September 2026 call; it's built off the daily retest zone that's already live.
The long-term table only comes into play if the weekly descending triangle confirms a breakout over the coming months, so treat those numbers as a multi-year roadmap rather than anything actionable this quarter.
On-Chain and Fundamental Drivers
Dogecoin's fundamentals haven't changed much in structure even as the chart has.
Market cap sits at $14.315B against a circulating supply of 155.632B coins, and because DOGE has no max supply, dilution is a constant background factor that separates it from capped assets like Bitcoin.
The project's treasury reportedly holds over 805 million DOGE, worth watching since large held balances can influence circulating liquidity if they ever move.
Trading volume of $1.148B over 24 hours keeps DOGE among the more liquid large caps, which matters for anyone trying to execute around these levels rather than just watch them.
September Catalysts That Could Move the Price
A few themes tend to swing DOGE harder than most large caps. Musk-linked headlines, whether about X Payments, Tesla, or offhand social posts, still move this coin more than fundamentals alone would suggest.
Broader risk appetite across crypto, tied to Bitcoin's trend and macro liquidity, sets the ceiling or floor for any $DOGE breakout. Exchange-driven volume spikes have historically preceded DOGE's sharpest short-term rallies.
None of these are guaranteed to hit in September; they're simply the usual suspects worth tracking alongside the chart.
What Analysts Are Forecasting
Sentiment across the trading community right now mirrors the chart itself, cautiously bullish above the retest zone and quick to flip if support fails.
The prevailing view among chart-focused traders is that DOGE needs to hold the low $0.09s to keep the breakout narrative alive, with resistance near $0.10 to $0.12 acting as the real test of conviction.
Bigger-picture forecasters tend to frame Dogecoin less around exact numbers and more around whether meme coin rotation returns as a market theme, since that flow has historically mattered more than any single technical level.
Long-Term Outlook: 2027 to 2030
The weekly descending triangle is the chart that matters most for anyone thinking multiple years out rather than weeks.
If that pattern confirms and later resolves the way similar Dogecoin triangle setups have in past cycles, the implied structure points toward a zone somewhere between $0.30 and $0.41, with an outside case stretching toward the mid-$0.40s if a full market-wide bull cycle returns.
That is a pattern projection, not a promise, and it depends on both a confirmed weekly breakout and a broader crypto bull market showing up to fuel it.
Treat any number this far out as a directional guide rather than a forecast to trade around.
Risks That Could Invalidate This Forecast
Every case laid out above depends on levels holding, and levels don't always hold. A daily close below $0.08879 undercuts the bull case and opens the door toward $0.079 and then $0.0714.
On the weekly, failure to close above the descending trendline keeps DOGE trapped in the same multi-year compression it's been fighting since the last cycle top.
Unlimited supply issuance is a structural headwind that never goes away, regardless of what the chart says.
And because Dogecoin leans so heavily on sentiment, a quiet news cycle can stall momentum just as easily as a bad one reverses it.
How to Buy and Store It Safely
Buying DOGE is straightforward on most major exchanges that list it against USDT or a local fiat pair.
Stick to platforms with real volume and transparent order books, since thin liquidity can widen slippage on a coin this volatile.
For storage, exchange wallets work fine for small active amounts, but larger holdings are safer on a hardware wallet like a Ledger or Trezor, which keeps private keys offline.
Whatever you choose, enable two-factor authentication and never share a seed phrase; no support agent will ever legitimately ask for it.
Glossary
Trendline: A sloped line connecting price highs or lows, used to gauge trend direction.
Demand zone: A price area where buying pressure previously overwhelmed sellers hard enough to reverse the trend.
Descending triangle: A pattern with flat lower support and a falling upper resistance line, usually resolving in the breakout's direction
RSI: The Relative Strength Index is a momentum gauge from 0 to 100, where above 70 typically reads overbought.
Resistance: A level where selling pressure has historically capped upward moves.
Support: The opposite of resistance, where buying pressure has historically stepped in.
Breakout: When a price closes decisively beyond a trendline or pattern boundary, it is often followed by a retest from the other side.
Methodology
This dogecoin price prediction for September 2026 explained piece is built directly from daily and weekly chart structure, current live market data, and standard technical analysis tools, including trendlines, RSI, and support and resistance mapping.
No price target above is treated as guaranteed, and every scenario includes a clear invalidation level so readers can track whether the thesis is still intact in real time.
Disclaimer: This article is for informational purposes only and does not constitute financial advice. Cryptocurrency markets are highly volatile, and prices can move sharply in either direction without warning. Always do independent research and consult a licensed financial advisor before making investment decisions.
0
0


 Manage all your crypto, NFT and DeFi from one place
Securely connect the portfolio you’re using to start.


