
Solana Price Prediction: SOL Breaks Channel, Eyes $60 Support

0
0

Solana is under pressure this week. The token has broken below its rising price channel, and that has traders watching closely.
As of July 31, 2026, SOL trades near $73.59, down slightly over the past day. The bigger worry is not today's dip. It's the shape of the chart.
Solana had been climbing inside a steady upward channel for weeks. That channel just broke.
When bears take control after a breakdown like this, the next stop traders often watch is a round support number. For SOL, that number sits near $60.
Is Solana bullish or bearish right now?
The short answer: mixed, leaning cautious.
Solana's 24-hour futures volume sits at $5.37 billion, down 19.31% from the prior session. Open interest has slipped 2% to $4.59 billion.
Options volume dropped 1.69% to $6.06 million, and options open interest fell sharply, down 40.65% to $62.95 million.
Falling open interest during a price drop usually means traders are closing positions, not adding new bearish bets. That's a sign of caution rather than panic.
The long/short ratio over the past 24 hours sits at 1.0206, close to even. On Binance, the SOL/USDT long/short account ratio is 2.5348, and OKX shows 2.56.
Binance's top trader ratio (by accounts) is 2.8625, while the top trader ratio by position size is 1.6592. More accounts are leaning long, but the biggest players are less convinced.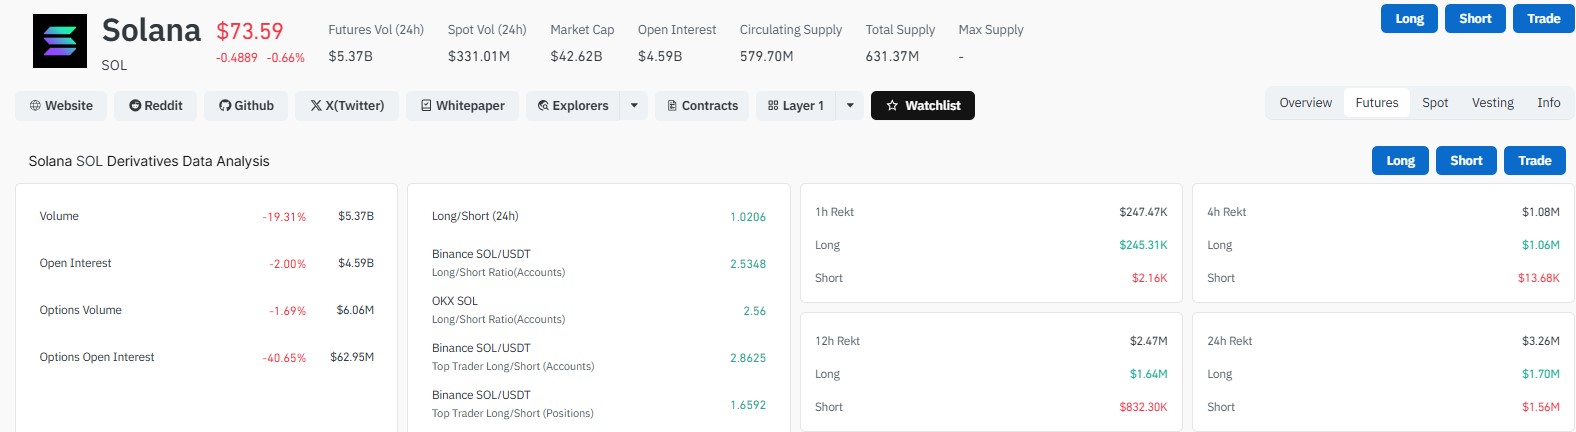
How much money has been liquidated in Solana trades?
Liquidation data shows real pain on both sides.
Timeframe | Total Rekt | Longs Liquidated | Shorts Liquidated |
1 hour | $247.47K | $245.31K | $2.16K |
4 hours | $1.08M | $1.06M | $13.68K |
12 hours | $2.47M | $1.64M | $832.30K |
24 hours | $3.26M | $1.70M | $1.56M |
Notice the pattern. In the short term (1h and 4h), longs are getting wiped out fast. That lines up with the channel breakdown. Traders who bet on continued upside got caught.
Why is Solana's TVL falling in 2026?
This is where the bigger story sits, and it's not just a chart pattern.
As per Defillama, on January 20, 2025, Solana's Total Value Locked stood at $11.48 billion. Its app revenue that day was $51.74 million.
By July 30, 2026, TVL had dropped to $4.782 billion. That's a decline of roughly 58% over about 18 months.
App revenue tells a similar story. It fell from $51.74 million down to around $3 million. That's a drop of more than 94%.
Lower TVL usually means less capital sitting in Solana's DeFi apps. Lower app revenue means less activity generating fees for the network.
Both point to a slowdown in on-chain usage, even as the token price itself moves with the broader market.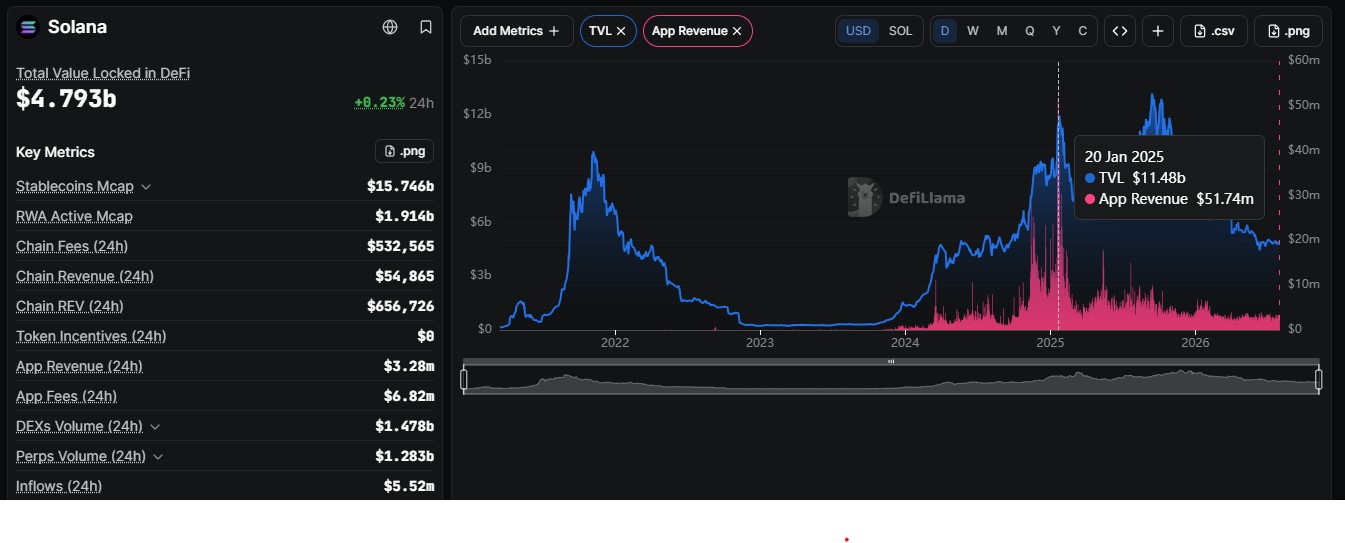
Solana Price Prediction: What does this mean for the $60 target?
Nothing about $60 is guaranteed. Price targets from chart patterns are not promises.
That said, the setup traders are watching is straightforward. SOL broke its rising channel. Open interest and options interest are both falling. TVL and revenue have dropped hard since early 2025.
If sellers keep pushing and buyers don't step back in, a slide toward the $60 area is the level many chart watchers have flagged.
On the other side, SOL's 52-week range runs from about $60.20 to $294.82, so $60 is not unfamiliar territory. It has acted as support before.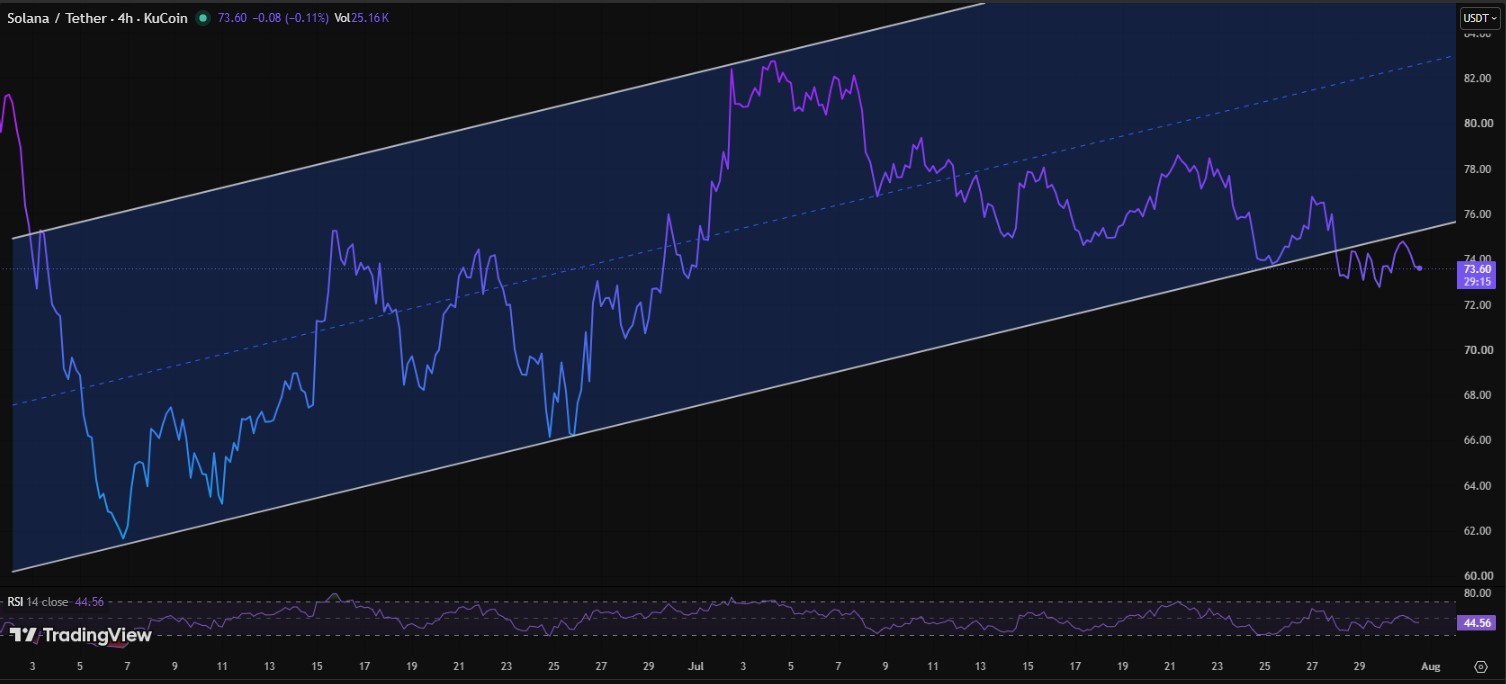
Whether Solana holds above $70 or slides toward $60 will likely come down to how quickly buyers respond to this channel break, and whether on-chain activity can stabilize.
Disclaimer: This article is for informational purposes only and does not constitute financial, investment, or trading advice. Cryptocurrency markets are highly volatile, and prices can change rapidly. Always do your own research and consult a licensed financial advisor before making any investment decisions. Past performance is not indicative of future results.
0
0

 Manage all your crypto, NFT and DeFi from one place
Securely connect the portfolio you’re using to start.

0
0

0
0

0
0

0
0