
Aptos Price Prediction: Rally Test $0.8914 Resistance After 6.84% Jump

0
0

Aptos price prediction talk is back because APT jumped 6.84% in 24 hours and now trades at $0.8270. Bulls want one thing. A clean break above $0.8914.
Data below is current as of October 2, 2026, 06:00 UTC, using the 4-hour APT/USDT chart on MEXC.
Aptos Price Prediction: What Is Happening Now?
Current Price and 24H Performance
APT price today sits at $0.8270 per CoinMarketCap price data, up 6.84% in 24 hours.
Buyers defended the $0.7580 low and pushed to $0.8392. Not bad.
Price is up 61.7% from the $0.5129 low set on August 31, 2026. But it's still 95.83% below the $19.90 peak from January 30, 2023.
Trading Volume and Market Cap
Trading volume, the value changing hands in 24 hours, is $74.58M. It's down 13.02%.
Market cap, which is price times circulating coins, is $720.46M. That's up 6.86%.
Price up, volume down. That's a yellow flag, not a red one.
And volume equals 10.27% of market cap, so liquidity stays healthy. Daily crypto market news can shift that quickly.
Supply and Valuation
Circulating supply is 871.1M APT, against a 2.1B max supply and 1.2B total supply.
Fully diluted valuation, which prices every future coin at today's rate, is $1.73B. Unlocked market cap is $554.23M.
More supply can arrive later. That's why valuation context matters when comparing crypto price predictions.
Why Is Aptos Moving Today?
Fresh headlines hit the feed. Buyers reacted fast.
Three updates landed on October 1, 2026 (UTC). All supportive.
Burn update: 166.9K APT burned in 30 days and 1.9M since mainnet, per the official Aptos burn update.
Bitkub update: native USDT is live on the Thai SEC-regulated exchange, which has 5M+ registered users.
Shelby update: Private Beta is rolling, built by Aptos Labs and Jump.
No one headline explains 6.84%. But together, they gave buyers a reason. Timing matters here.
$APT Technical Analysis
Aptos technical analysis here relies on one 4-hour chart, with RSI 14 and EMAs set to 20, 50, 100, and 200.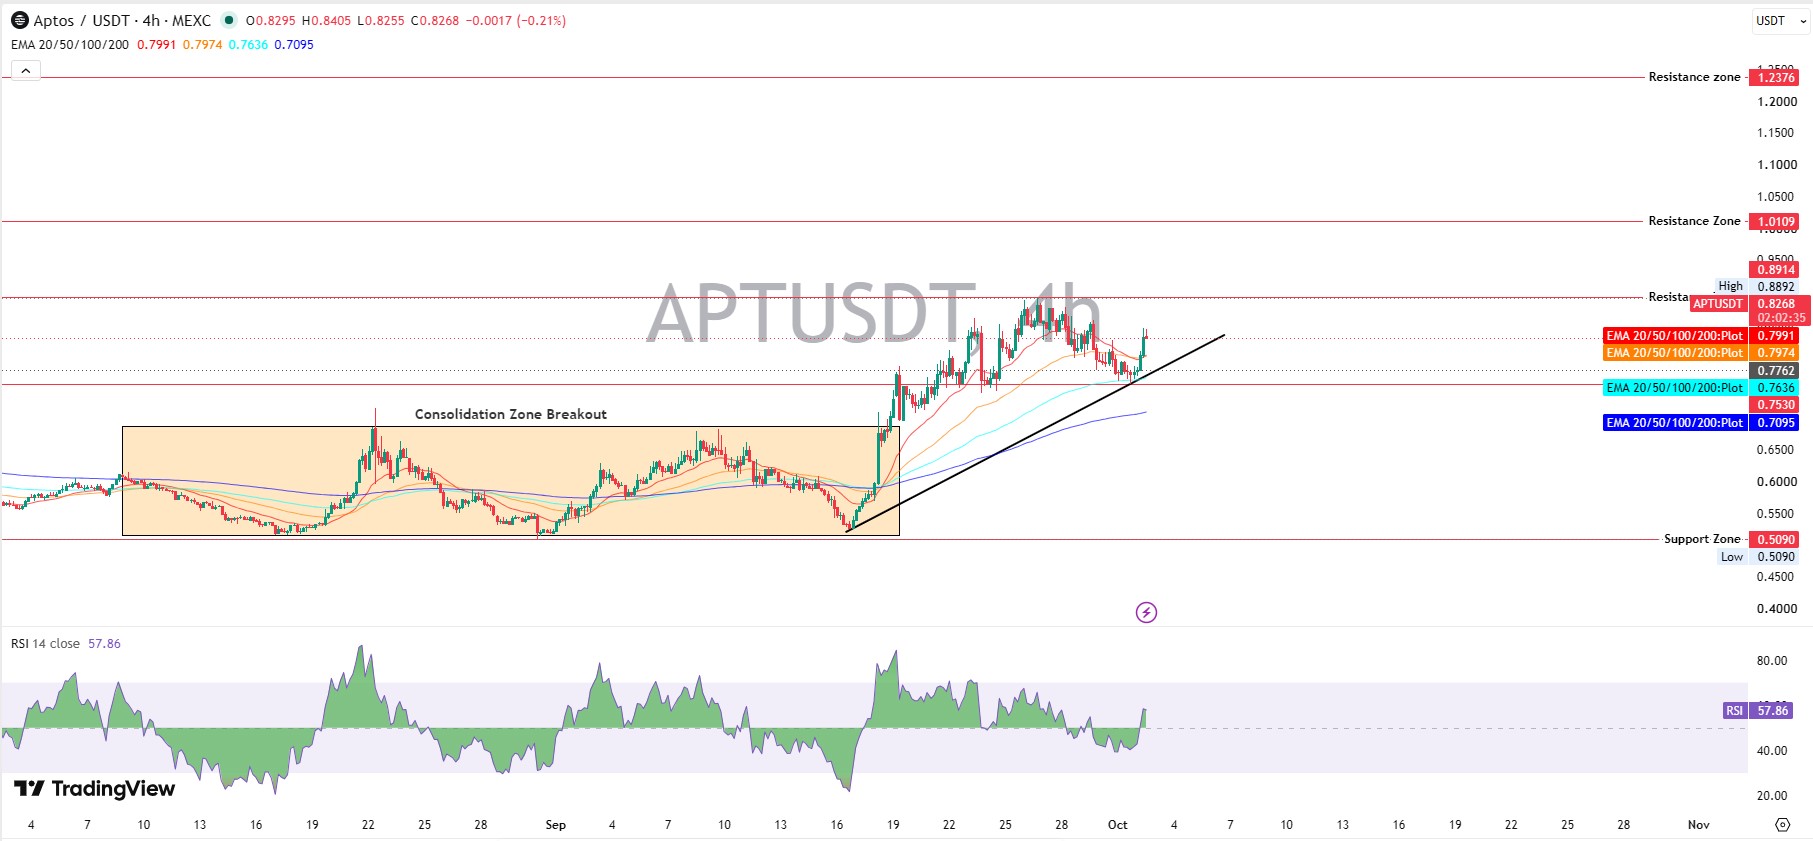
RSI and EMA
RSI, it reads 57.86 on the TradingView chart, so momentum is positive but not overheated.
EMA, or exponential moving average, is a trend line that weights recent trades more heavily. The price sits above the 20 EMA at $0.7991, the 50 EMA at $0.7974, the 100 EMA at $0.7636, and the 200 EMA at $0.7095.
All four sit below price. And that's a bullish structure.
Key Support Levels
Support is a zone where buyers have stepped in before. Near-term floors sit at $0.7762, $0.7636, and $0.7530.
A rising trendline runs through that area. And that's the bulls' line, so the $APT support and resistance map stays friendly while it holds.
Below that, $0.7095 and the $0.5090 base wait. Earlier levels were mapped in the Aptos September 2026 forecast.
Key Resistance Levels
Resistance is where sellers tend to show up. First wall: $0.8914, just above the $0.8892 recent high.
Next zones: $1.0109 and $1.2376.
Past seller behavior is covered in the Aptos seller pressure analysis.
Can $APT Rally Continue?
Momentum Check
So is this rally real, or just a bounce into a wall?
Evidence leans real. Price sits above every EMA and the rising trendline.
But volume fell 13.02%. And that keeps the short-term outlook bullish with a leash.
Call it bullish. Actually, make that cautiously bullish. Sentiment turns fast, so AI crypto news is worth a scan.
Aptos Price Prediction for October 2026
This Aptos price prediction for October 2026 view covers the next 30 days. Scenarios aren't promises.
Bull Case
If APT breaks and holds above $0.8914 on rising volume, it could test $1.0109. Can Aptos reach $1.0109? Possible, though it would depend on buyers showing up.
$1.2376 becomes the next $APT price target only if momentum builds. Invalidation: a drop under $0.7762.
Wider access could add demand, so fresh exchange listing news is worth tracking.
Base Case
The base case is a range between $0.7530 and $0.8914, while the price digests the jump.
Under this scenario, APT chops sideways and the EMAs catch up. Earlier ranges are covered in the Aptos August 2026 forecast.
Bear Case
A breakdown below $0.7530 and the rising trendline would flip the bias. First target: the 200 EMA at $0.7095.
Reaching $0.5090 would need broad market weakness. Unlikely, but not impossible.
Key Levels to Watch
Breakout Confirmation
Breakout confirmation needs APT trading above $0.8914, holding there, and volume rising.
A quick spike that fades isn't confirmation.
Breakdown Risk
Breakdown risk starts below $0.7530. A move under $0.7095 would damage the whole September structure.
Risks That Could Change the $APT Price Prediction
Falling volume, token unlocks, Bitcoin weakness, and failed breakouts could all derail the setup.
New tokens compete for attention too, including crypto presale projects. Liquidity is finite.
Final Takeaway
Short-term bias is bullish. But $0.8914 decides the next move.
Hold $0.7530, and bulls stay in control. Lose it, and the APT price forecast turns cautious fast.
Disclaimer: This article is for information only and isn't financial advice. Crypto prices are volatile, scenarios aren't guaranteed, and readers should research independently before trading.
0
0

 Manage all your crypto, NFT and DeFi from one place
Securely connect the portfolio you’re using to start.


