
Aptos price prediction for 2026 – 2032: Will APT token hold bullish hopes?

0
0

Key takeaways:
- Our Aptos price prediction anticipates a high of $3.54 by the end of 2026.
- In 2028, it will range between $19.33 and $25.91, with an average price of $20.18.
- In 2030, it will range between $79.95 and $99.65, with an average price of $82.60.
Our Aptos price prediction expects APT to reach a high of $3.54 by the end of 2026, move above $10 in 2027, and potentially hit $100 by 2032, with an average price of $125.84 in 2032.
The Aptos blockchain has aggressively attracted capital to its ecosystem, with total value locked (TVL) exceeding $191 million, while Aptos remains a high-performance layer-1 blockchain with a mature decentralized finance (DeFi) ecosystem.
For crypto investors, traders, and enthusiasts weighing APT’s investment potential, this forecast breaks down Aptos’s price history, technical analysis, market sentiment, trading volume, and short- and long-term price predictions from 2026 to 2032 so you can judge where the token may fit in an evolving crypto market.
Aptos network continues to build decentralized applications and tools for developers, and tracking APT’s outlook helps readers assess risk, spot market trends, and make better-informed investment decisions.
Overview
| Cryptocurrency | Aptos |
| Symbol | APT |
| Current price | $0.6134 |
| Aptos crypto market cap | $510.99M |
| Trading volume | $72.94M |
| Circulating supply | 832.97M |
| All-time high | $19.90 on Jan 30, 2023 |
| All-time low | $0.6097 on Jun 11, 2026 |
| 24-hour high | $0.6449 |
| 24-hour low | $0.5949 |
Aptos price prediction: Technical analysis
| Metric | Value |
| Volatility (30-day variation) | 5.01% (High) |
| 50-day SMA | $0.7386 |
| 200-day SMA | $1.07 |
| Current APT sentiment | Bearish |
| Green days | 14/30 (47%) |
| Fear and Greed Index | 27 (Fear) |
Moving averages are a technical analysis tool used to identify trends and potential support or resistance levels. APT is trading below its 50-day and 200-day Simple Moving Averages, so those levels act as resistance. By June 28, 2026, the 50-day SMA is expected at $0.8468, while the 200-day SMA is projected at $1.14.
Aptos price analysis
At press time, July 8, Aptos had crossed below $0.70, down 4.47% in 24 hours and 10.76% in 30 days. Broader market price movements in large-cap coins can affect APT, and data show that Aptos’s price is currently correlated with Polkadot and Shiba Inu. Market sentiment can significantly influence Aptos price predictions, while broader market conditions, such as interest rates and inflation, can also affect the chain. Its trading volume rose by 28.88% over the last 24 hours to $73 million.
Aptos 1-day chart price
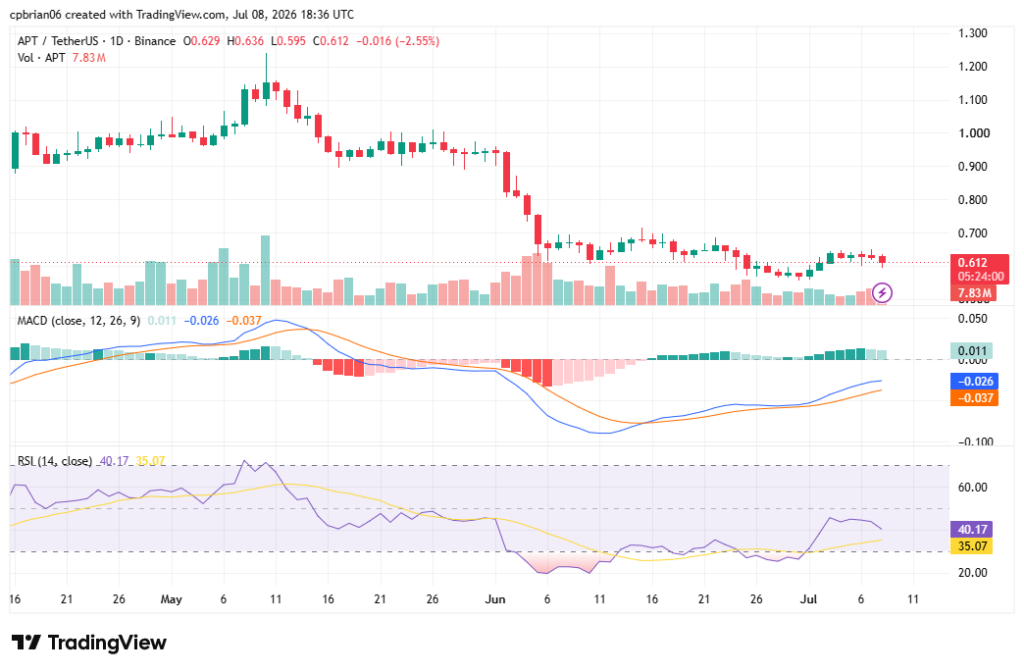
The MACD histograms show that this week’s APT run was driven by positive momentum, with recent price action following a decline before stabilizing. The move came after APT bounced off support at $0.5741, with lower support levels at $0.5542 and $0.5420. Its relative strength index (RSI) is neutral (40.17). RSI is an oscillator, a technical analysis tool that constructs upper and lower bands based on two extreme values (30 and 70). Traders use this trend indicator to spot short-term oversold conditions and possible reversals as it tracks fluctuations within those bands. In practice, it constructs high and low bounds from extreme values, with low bands helping flag potential weaknesses. It is oversold when the value drops below 30.
Aptos 4-hour chart price analysis
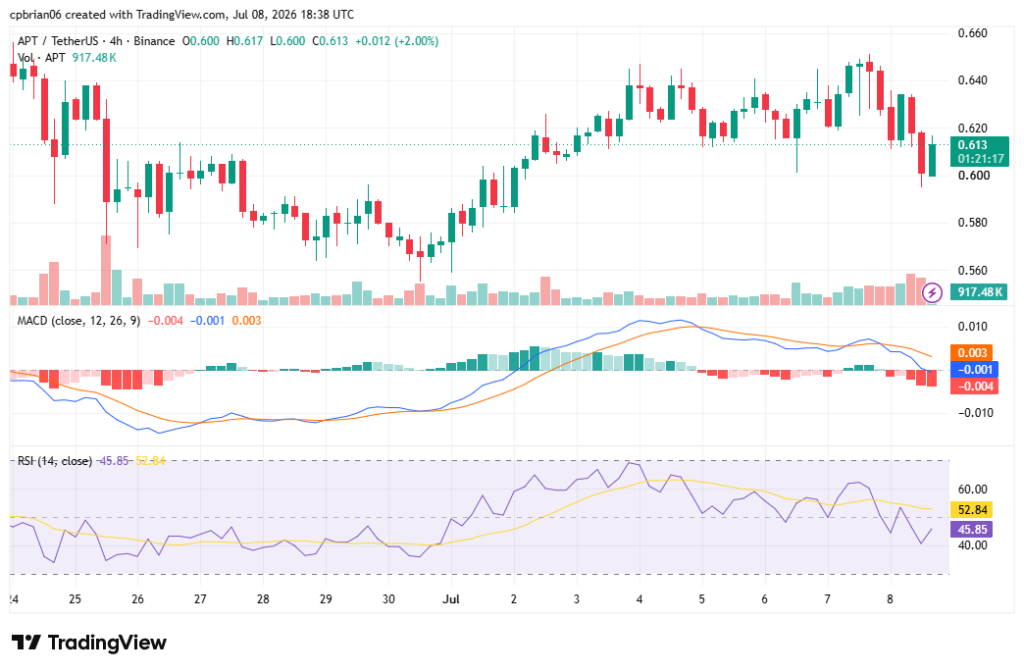
The chart highlights APT’s run this month. The latest formation suggests a bearish market. Its momentum is negative, limiting any gains above $0.66. Based on today’s classical pivot point, key support is at $0.60, while Aptos’s resistance level is at $ 0.6682. A move above those levels would help confirm a recovery before sending it back to the June highs at $0.85.
Aptos technical indicators: Levels and action
Daily simple moving average (SMA)
| Period | Value ($) | Action |
| SMA 3 | 0.6301 | SELL |
| SMA 5 | 0.6271 | BUY |
| SMA 10 | 0.6024 | BUY |
| SMA 21 | 06215 | BUY |
| SMA 50 | 0.7386 | SELL |
| SMA 100 | 0.8449 | SELL |
| SMA 200 | 1.07 | SELL |
Daily exponential moving average (EMA)
| Period | Value ($) | Action |
| EMA 3 | 0.6290 | SELL |
| EMA 5 | 0.6236 | BUY |
| EMA 10 | 0.6175 | BUY |
| EMA 21 | 0.6341 | SELL |
| EMA 50 | 0.7181 | SELL |
| EMA 100 | 0.8577 | SELL |
| EMA 200 | 1.32 | SELL |
What to expect from the APT price analysis next?
According to the technical indicators, APT’s near-term price action remains weak. Over the short term, the predicted move suggests a drop. Even so, the 2026 outlook implies a 2.74% potential return on investment, with an average annualized price of $0.7348. Market sentiment and whale activity can still drive a potential short rebound or renewed weakness. There is support at $0.06, which, if broken, could send APT to $0.52; otherwise, reclaiming $0.70 would confirm improving momentum if the market reverses.
Why is Aptos down?
There is widespread altcoin weakness, with technical breakdowns detected across several major tokens, including APT, triggering sell signals and momentum loss.
Will Aptos reach $10?
Yes, Aptos will rise above $10 in 2027. The move will come as the market corrects to previous highs.
Will Aptos reach $100?
According to the Cryptopolitan price prediction, Aptos will reach $100 in 2032.
Will Aptos reach $1000?
Per the Cryptopolitan price prediction, it remains unlikely that Aptos will get to $1000 before 2032.
What is the long-term price prediction for Aptos?
According to Cryptopolitan price predictions, Aptos will trade higher in the years to come. However, factors such as market crashes or stringent regulations could undermine this bullish thesis, even though strong technological and scalability support the long-term case. Scaling beyond 100,000 transactions per second would also shape the long-term impact, while investment still carries risk if superior Layer 1 or Layer 2 solutions weaken Aptos’s market position.
How high can Aptos coin go?
Per the Cryptopolitan price prediction, Aptos will reach a high of $146 in 2032.
Recent news
The Aptos community passed a proposal to introduce deflationary tokenomics in a vote that ended on March 1, and the governance reforms also increased gas fees and set a hard cap on the total supply of APT tokens at 2.1 billion, aligning with a broader shift towards performance-driven tokenomics.
Aptos still has a 7% yearly inflation rate, which matters for token holders and future supply dynamics.
Aptos price prediction July 2026
The Aptos price forecast for June ranges from a minimum of $0.58 to a maximum of $0.91. The average price for the month will be $0.69.
| Month | Potential low ($) | Potential average ($) | Potential high ($) |
| July | 0.58 | 0.69 | 0.91 |
Aptos price prediction 2026
For 2026, APT’s price will range between $0.55 and $3.54. The average price for the period will be $2.72.
| Year | Potential low ($) | Potential average ($) | Potential high ($) |
| 2026 | 0.55 | 2.72 | 3.54 |
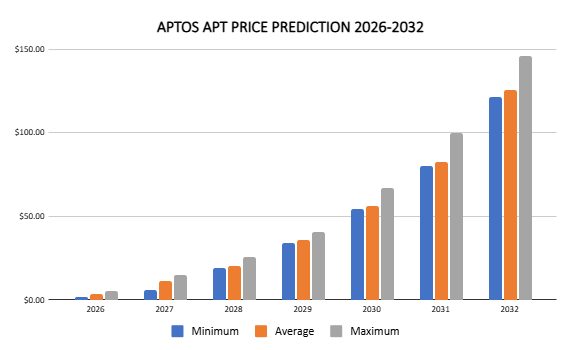
APT price prediction 2027–2032
| Year | Potential low ($) | Potential average ($) | Potential high ($) |
| 2027 | 5.59 | 11.18 | 14.84 |
| 2028 | 19.33 | 20.18 | 25.91 |
| 2029 | 34.08 | 35.59 | 40.67 |
| 2030 | 54.42 | 56.24 | 67.14 |
| 2031 | 79.95 | 82.60 | 99.65 |
| 2032 | 121.21 | 125.84 | 145.97 |
Aptos price prediction 2027
The Aptos APT price prediction estimates it will range between $5.59 and $14.84, with an average price of $11.18. Other forecasts place 2027 in a much lower range of $0.6472 to $0.9467, with 2.42% upside at the upper target. Many platforms also place Aptos’s price forecast in a $10 to $30 trading range over the next two years.
Aptos price prediction 2028
Aptos coin price prediction climbs even higher into 2028. According to predictions, APT’s trading price will range from $19.33 to $25.91, with an average price of $20.18.
Aptos price prediction 2029
Our analysis indicates a further acceleration in APT’s price. It will trade between $34.08 and $40.67, with an average price of $35.59.
Aptos price prediction 2030
According to the Aptos forecast for 2030, the APT price will range from $54.42 to $67.14, with an average of $56.24.
APT price prediction 2031
According to the Aptos price prediction for 2031, the price will range between $79.95 and $99.65, with an average of $82.60.
Aptos price prediction 2032
The Aptos price prediction for 2032 is a high of $145.97. It will reach a minimum price of $121.21 and an average price of $125.84. For readers asking how much Aptos will be worth farther out, some longer-range models predicted it could reach $1.04 by 2041.
APT market price prediction: Analysts’ APT price forecast
| Platform | 2026 | 2027 | 2028 |
| Coincodex | $0.7903 | $1.76 | $1.18 |
| Gate.com | $1.01 | $1.23 | $1.47 |
Cryptopolitan’s APT price prediction
Our predictions indicate that APT will reach a high of $3.54 by the end of 2026. Aptos price predictions are influenced by technological advancements, market sentiment, and institutional adoption. Future appreciation also depends on Total Value Locked, dApp ecosystem maturity, and demand. In 2028, it will range between $19.33 and $25.91, with an average of $20.18. In 2031, it will range between $79.95 and $99.65, with an average price of $82.60. Note that the content provided and other content are for general information purposes only and are not investment advice; they should not be treated as financial, fiscal advice, or other advice before making any investment decision. Seek independent professional consultation or do your research.
Aptos historic price sentiment
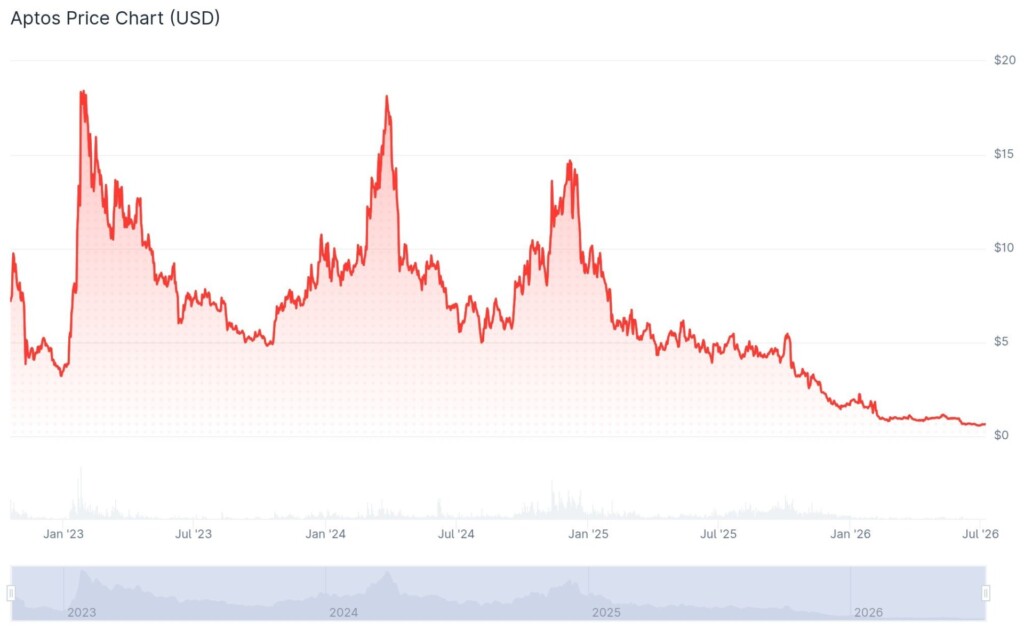
- Aptos raised seed funding in January 2022, led by a16z. Series A funding included Apollo, Dragonfly, Franklin Templeton, and others.
- Some members previously worked on the Diem blockchain, a project proposed by Facebook.
- The Aptos mainnet launched in October 2022 with an initial supply of 1 billion tokens, using the Move programming language, which is optimized for blockchain applications.
- After the launch hype, Apt fell to its lowest in December 2022, at $3.09. A month later, the tables turned, as it peaked at $19.90 on January 30, 2023.
- It pumped, partly driven by the NFT market. Collections such as Aptos Monkeys and Aptomingod have attracted more users.
- On June 6, it fell below its initial listing price, extending losses from the preceding months.
- In October, it began correcting, rising to $8.47 in November.
- In 2024, it broke above $10, reaching $18 in March. From April, it reversed and fell below $10. By September, it had fallen to $6. It recovered in October, rising above $7.50. It crossed into November, trading at $8.9, and rose to $13.91. It corrected and traded at $13.24 into December.
- It was later corrected and crossed into 2025, trading at $8.71. The drop continued into February, and in May, it fell below $5.10.
- In October, it crossed above $5.30, then assumed a bear run, and by November, it had dropped to $3.21. In December, it reached support levels at $1.70. It maintained the levels into January 2026.
- Later, it turned bearish, falling below $1 in March and $0.90 in April. In May, it rose back above $1.00. In June, it had dropped to $0.65. It maintained the level into July.
0
0

 Manage all your crypto, NFT and DeFi from one place
Securely connect the portfolio you’re using to start.

0
0

0
0

0
0

0
0