IOTA price nears $0.15
4y ago
bullish:
1
bearish:
0
Share

The IOTA price line trades just below the $0.15 mark on the price chart for the 5th of April. The cryptocurrency varied between the $0.146 and $0.151 marks for the day’s trade.
1-Day IOTA Price Analysis (5th April)
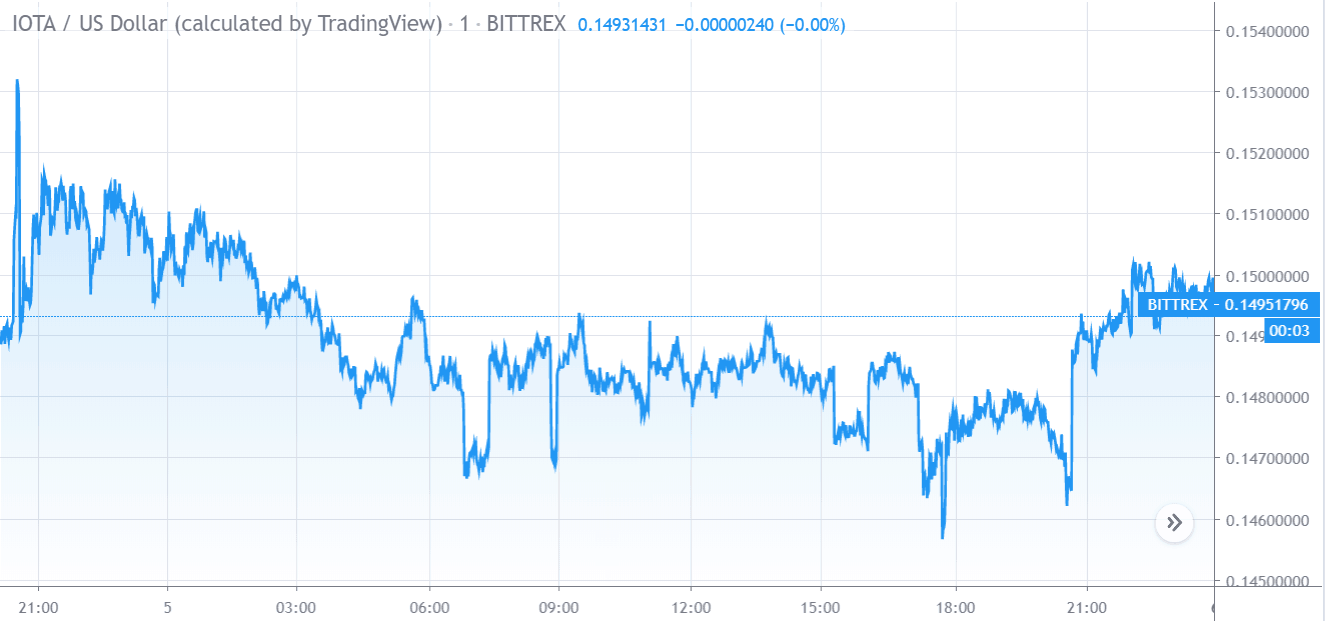
IOTA Price Chart by TradingView
The cryptocurrency stood at the $0.15053620 mark at the beginning of the day’s trade. The IOTA / US Dollar trading move gradually moved below the $0.149 mark until it reached a day’s low of $0.14562603 US Dollars. After approaching the day’s low, the coin saw some price recovery towards the $0.150 level, where it eventually closed the day with a trading value of $0.14951796 US Dollars.
IOTA: technical indicators
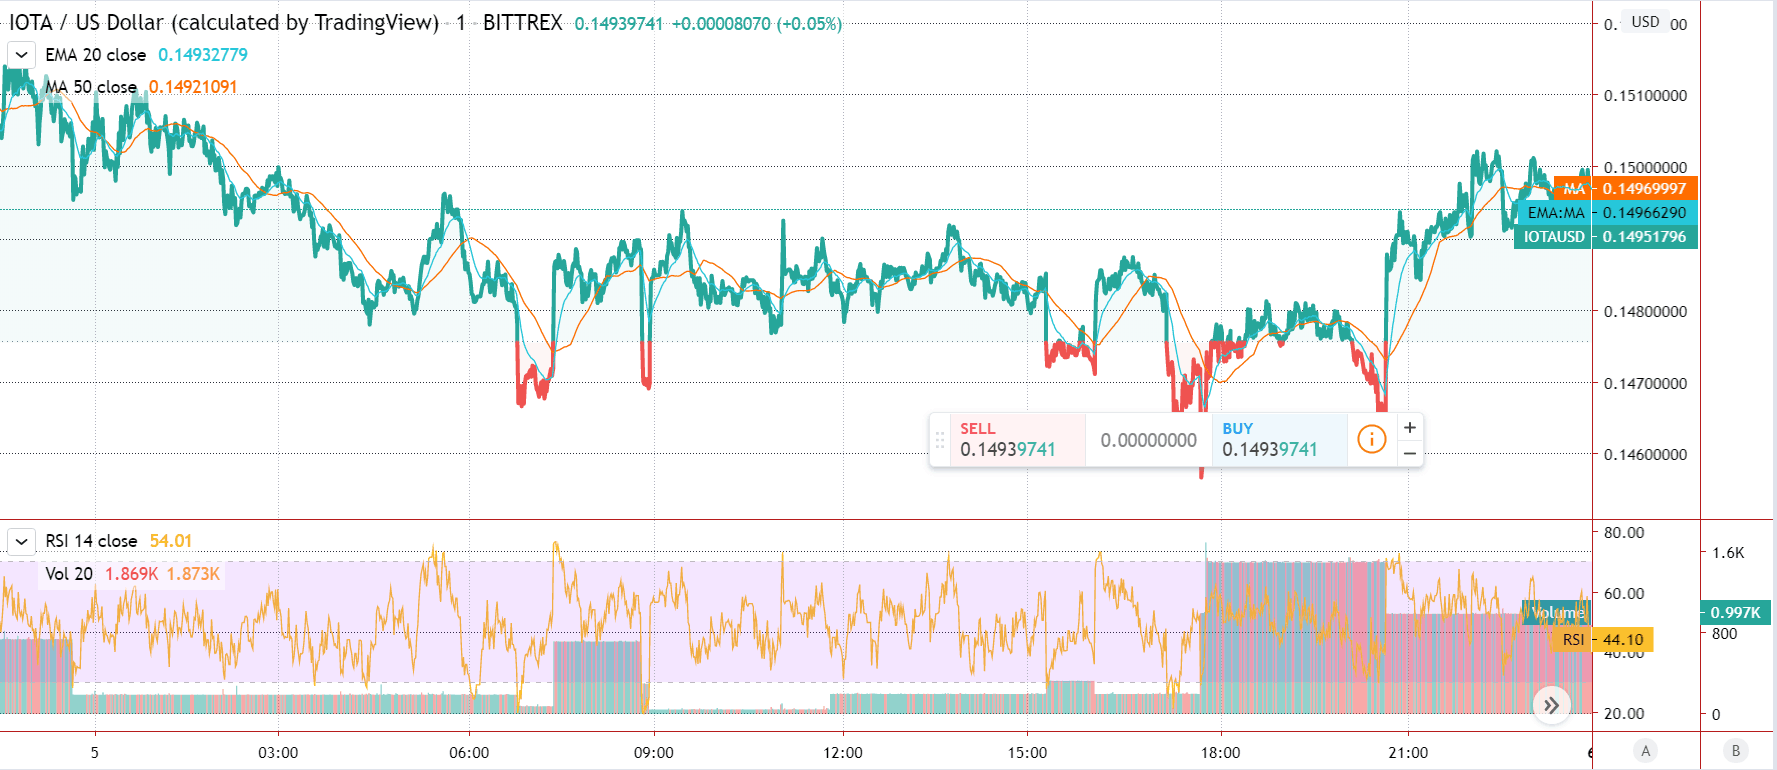
IOTA Featured Price Chart by TradingView
The 20-Day Exponential Moving Average (EMA) closed below the 50-Day Moving Average (MA), at $0.14966290. The 50MA closed the day’s trade above the 20EMA, at $0.14969997 US Dollars.
The Relative Strength Index (RSI) seems to be varying quite normally, hence there are no certain oversold or overbought instances for the coin on the 5th of April. The RSI closed the day at the 44.10 mark.
Featured Image by Gerd Altmann.
Disclaimer: The information provided is not trading advice but an informative analysis of the price movement. Cryptopolitan.com holds no liability towards any investments based on the information provided on this page.
4y ago
bullish:
1
bearish:
0
Share

 Manage all your crypto, NFT and DeFi from one place
Securely connect the portfolio you’re using to start.

bullish:
1
bearish:
0

bullish:
1
bearish:
0


bullish:
1
bearish:
0