XRP Technical Charts Show Potential Drop to a Dollar

0
0

XRP trades near $1.42 on April 21 as a tightening 4-hour structure collides with a developing head-and-shoulders pattern on the daily chart, pointing toward $1.00.
Short-term accumulation signals suggest buyers still have a narrow window to defend $1.44, yet the larger daily structure remains the dominant threat to XRP price stability.
Daily Head and Shoulders Pattern Points XRP Toward $1.00
The daily chart tells a heavy story. Measuring candle closes rather than wicks, XRP has printed a textbook head and shoulders pattern. The left shoulder formed on February 15, the head on March 17, and the right shoulder on April 17, with the neckline running through the $1.28 to $1.31 support zone.
Daily volume has been declining through the right-shoulder formation, the classic confirmation profile for the setup. A confirmed daily close below $1.28 would activate a measured move toward $1.00, with $1.25 acting as the first interim stop.
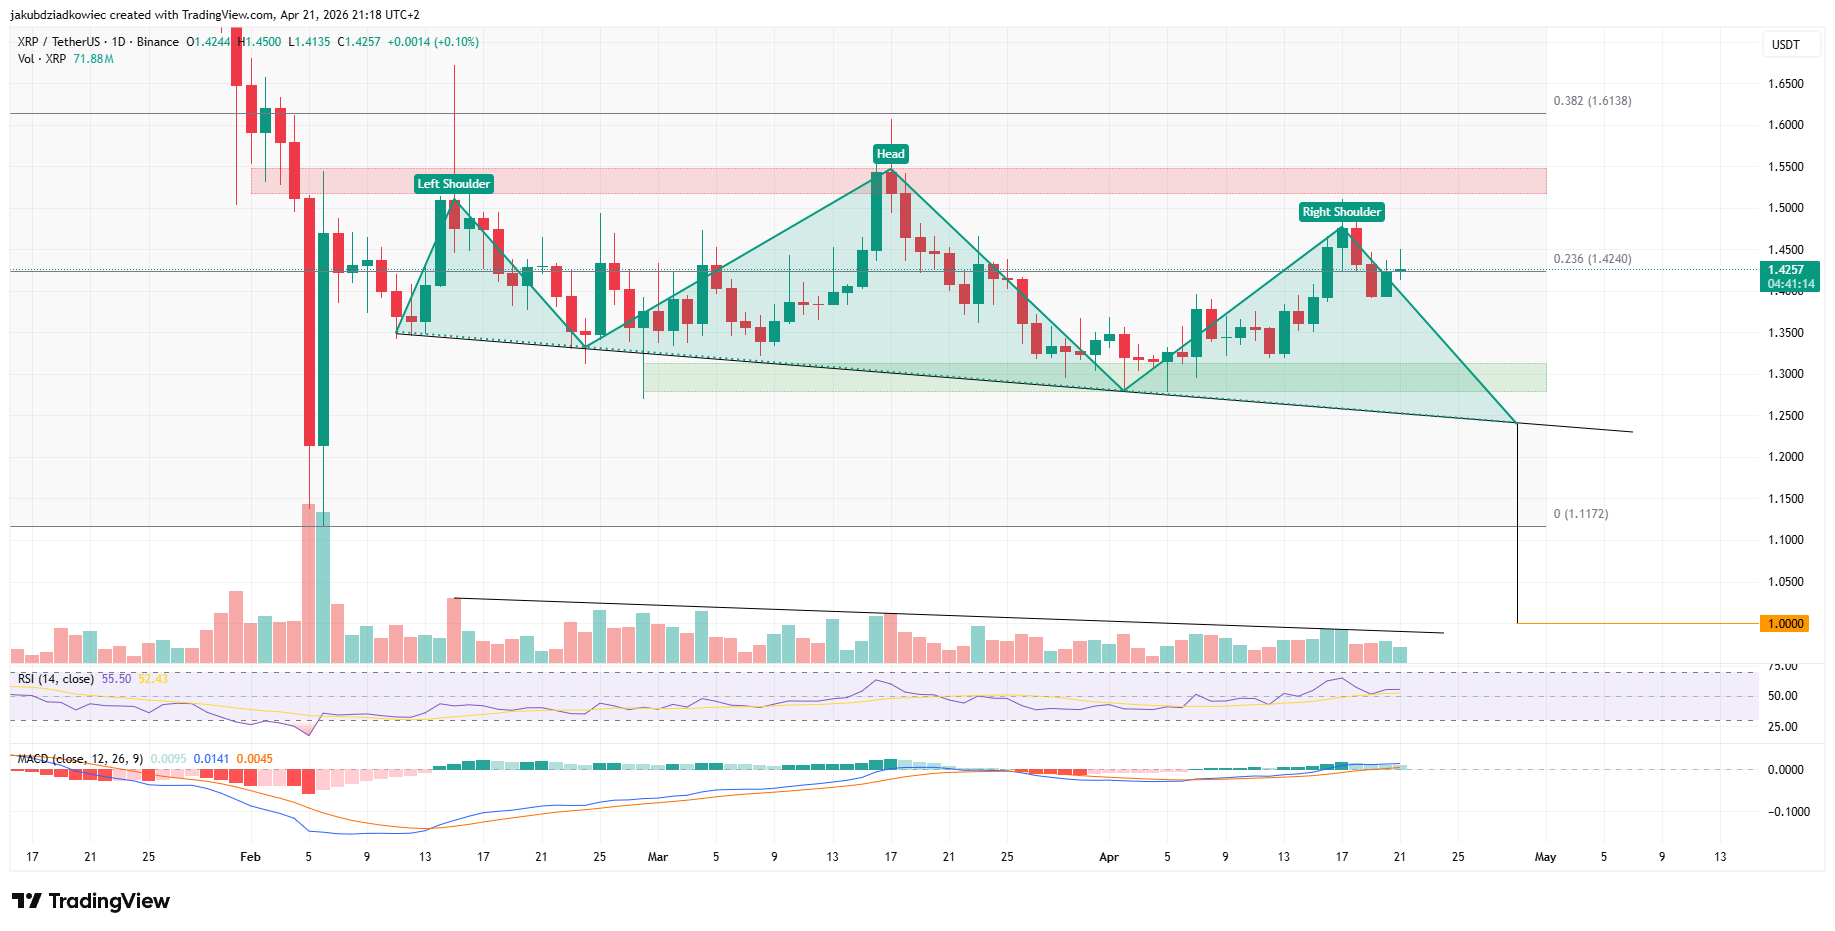 XRP daily chart / Source: Tradingview
On the bullish side, the 14-day RSI is recovering in the neutral zone after rejecting a peak of 65 in March, while the MACD histogram remains positive, though momentum is fading.
A decisive daily close above the $1.51 to $1.55 resistance box would invalidate the head and shoulders and reopen a push toward the 0.382 Fibonacci level at $1.61.
Seven spot XRP ETF applications now sit in final SEC review, with Q2 2026 decisions expected. Any early approval or surprise catalyst could override the bearish pattern entirely.
For now, XRP bulls must first reclaim the $1.51 to $1.55 zone to neutralize the risk of a $1.00 retest.
XRP 4-Hour Chart Shows Accumulation After Volatility Spike
The 4-hour XRP chart shows Bollinger Bands tightening after the recent expansion phase that drove price to $1.48. Following the pullback, XRP is trading at $1.43 and compressing against the middle band.
Volume has been steadily descending through the consolidation, a textbook accumulation signal. The Relative Strength Index (RSI) reads near 50, while the Moving Average Convergence Divergence (MACD) sits neutral after a mild bearish cross.
The key short-term levels are clear. Support holds at $1.38, while the first overhead barrier rests at $1.46. A 4-hour candle close above $1.46 would reopen the door toward the $1.50 region and flip near-term bias back to buyers.
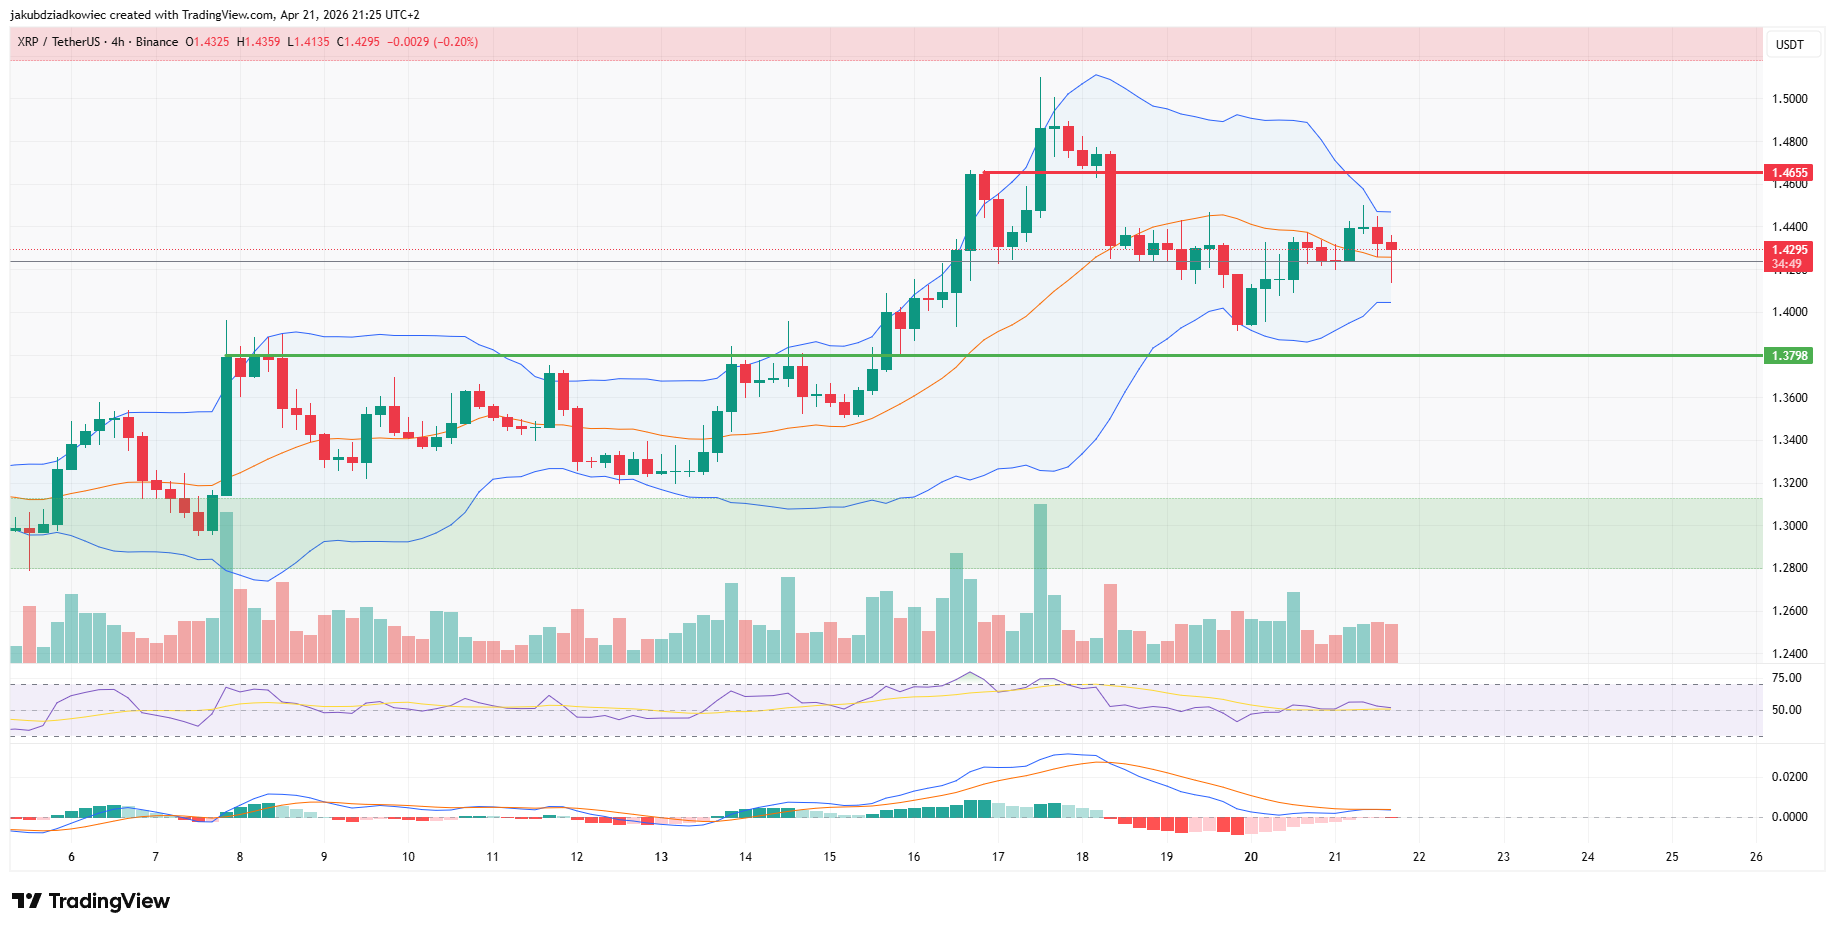 XRP 4-hour chart. Source: Tradingview
Crypto Tony Flags $1.44 as Trend Pivot for XRP Bulls
The one-hour chart from trader Crypto Tony highlights $1.44 as the essential level for XRP to reclaim before any continuation higher. That price sits just above spot and marks the upper edge of the current intraday range.
XRP has repeatedly tested $1.44 from below but failed to print a decisive hourly close above it. Failure at this pivot keeps the bounce from $1.39 in play as a short-covering move rather than a sustained consolidation leg.
The $1.44 level also aligns with the cost basis of roughly 60% of the circulating supply, according to on-chain data, which explains why every recent rally has been sold into.
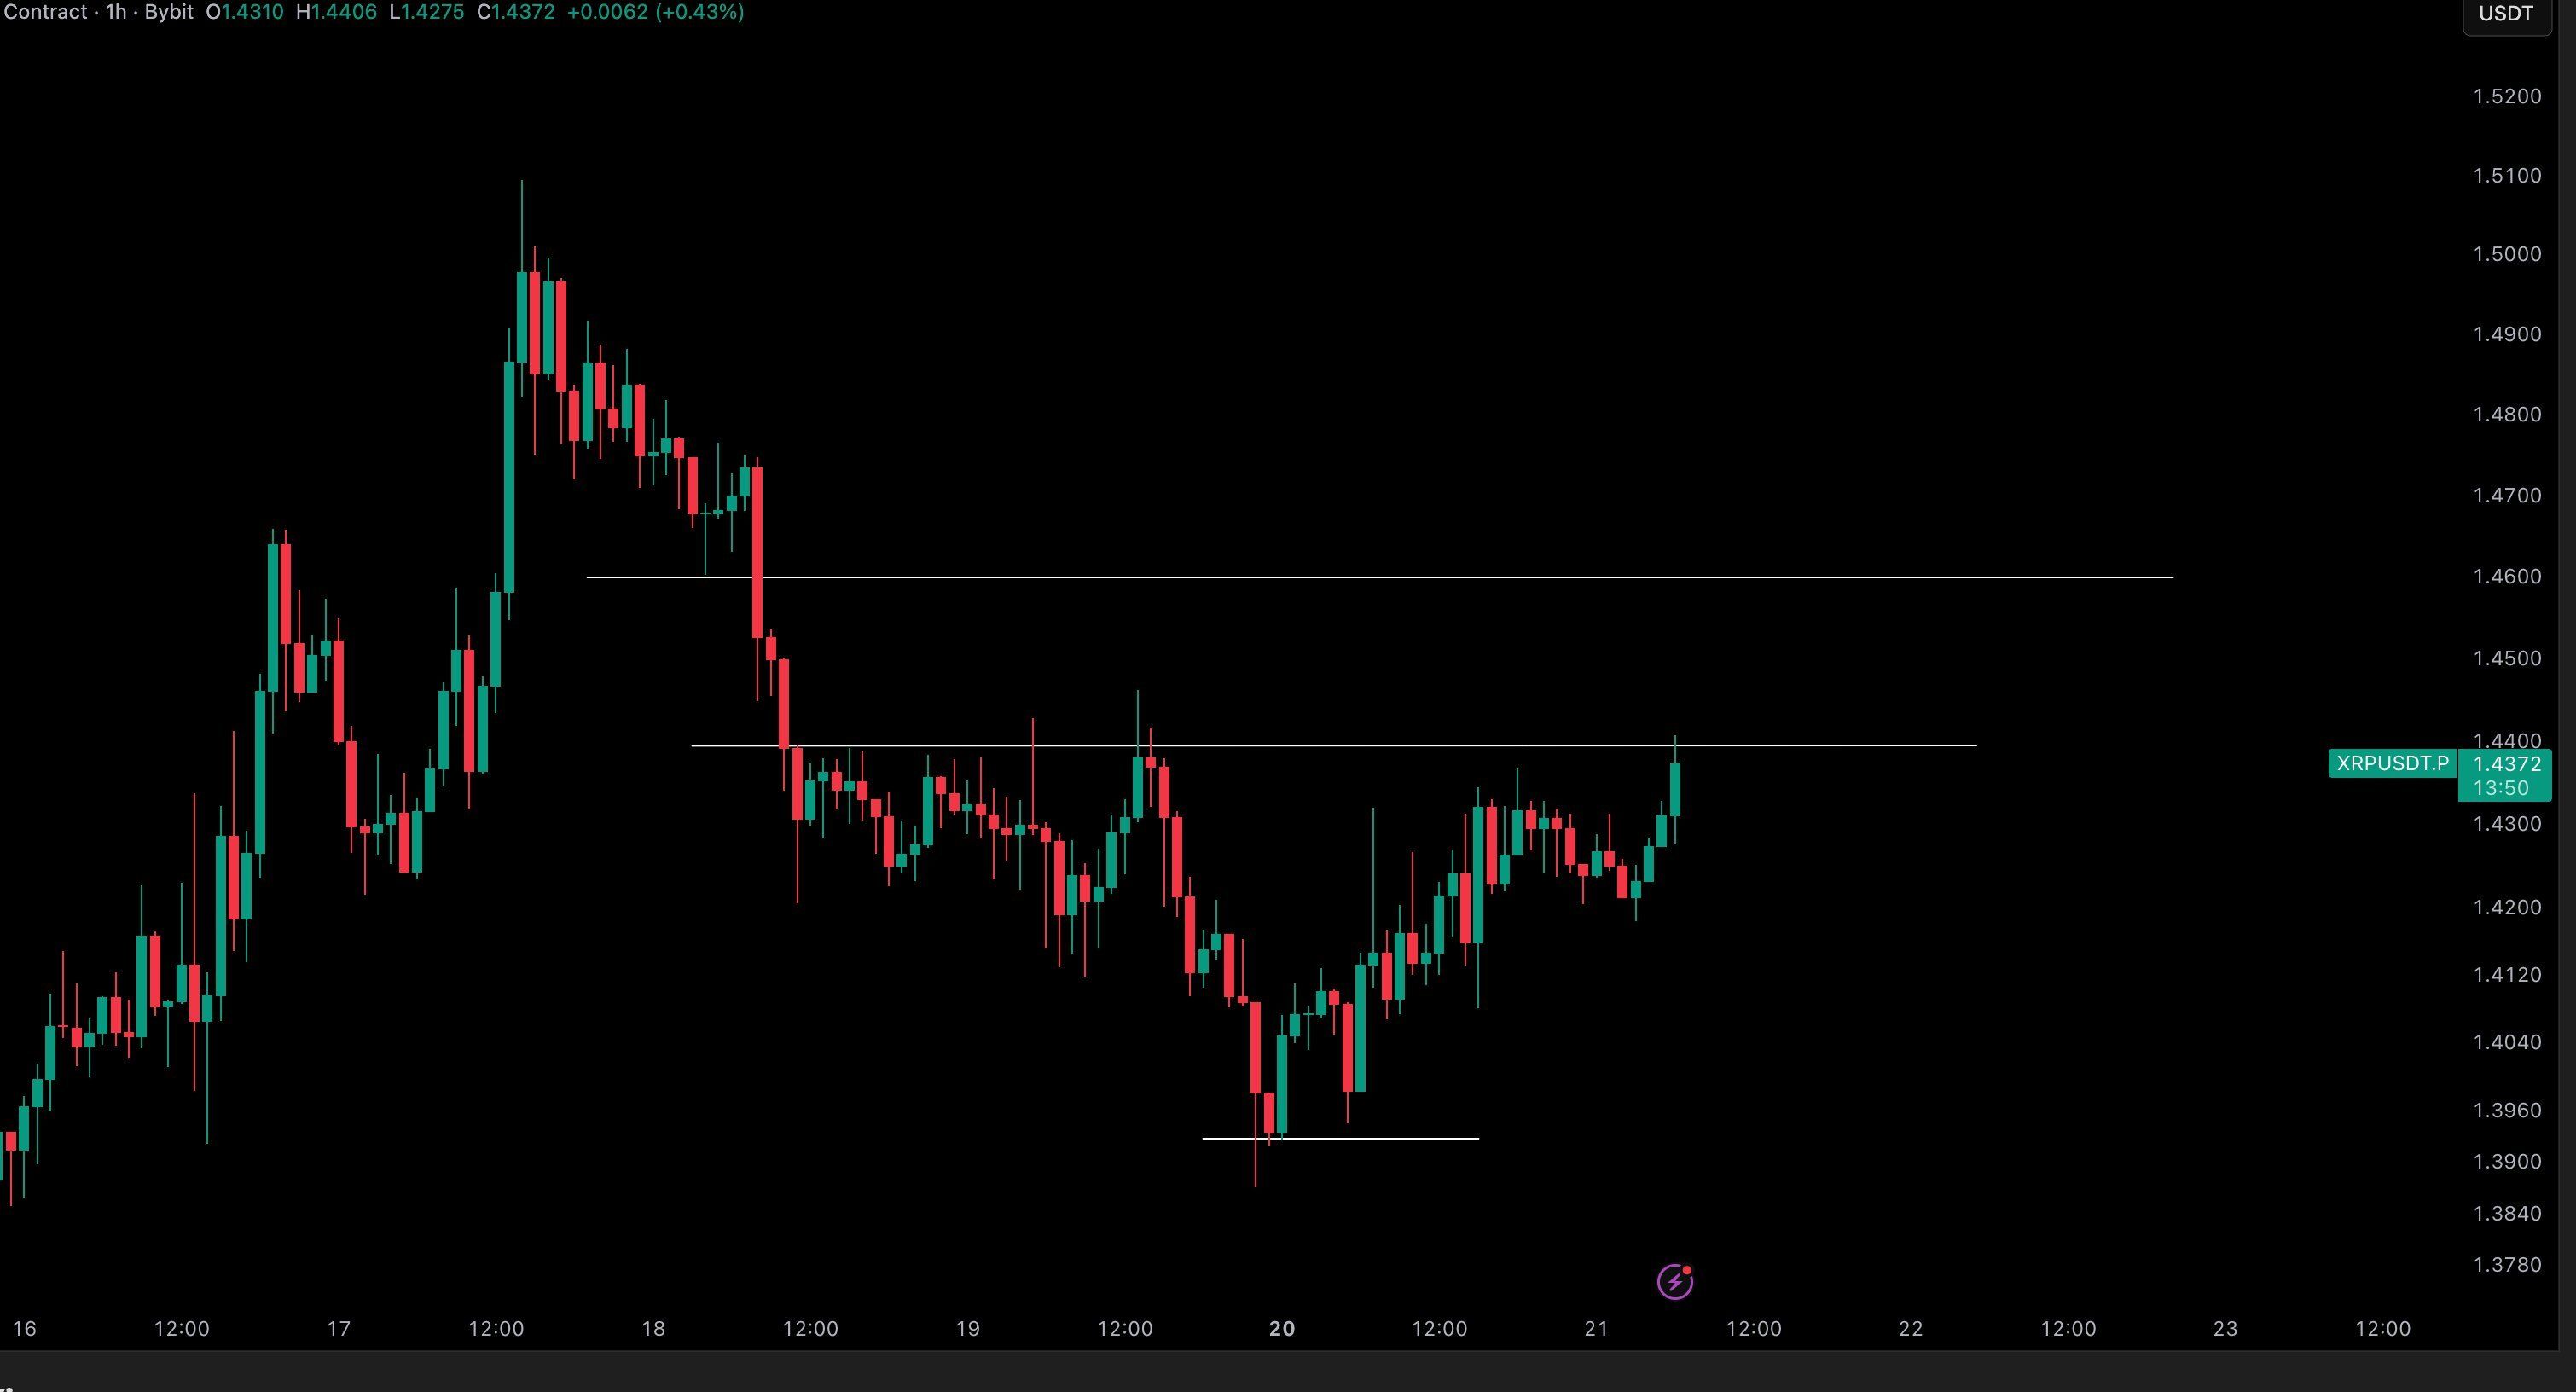 XRP hourly chart. Source: X
A clean hourly close above $1.44 would align with the 4-hour breakout thesis and bring $1.46 into immediate focus. A rejection leaves XRP vulnerable to another retest of $1.39, especially with the dominant daily pattern still in play.
0
0


 Manage all your crypto, NFT and DeFi from one place
Securely connect the portfolio you’re using to start.

0
0


0
0

0
0