
Chainlink Price Prediction: $LINK 20X Possible or Just Hype?

0
0

Chainlink just bought back another 91,100 $LINK tokens for its reserve, pushing total holdings toward $68 million, with not a single token sold since purchases started.
$LINK's spot ETFs are also seeing fresh inflows after a quiet start to September. LINK is trading near $11.35, down slightly on the day.
With buybacks and ETF demand both picking up, this Chainlink price prediction asks what it would actually take for LINK to deliver a 20x.
Market data was checked on September 13, 2026, based on the chart timestamped 3:37 (UTC).
Chainlink Price Prediction Today: Market Overview
Metric | Value |
Price | $11.353 |
24h Range | $11.26 - $11.62 |
Market Cap | $8.493B |
FDV | $11.352B |
24h Volume | $216.007M |
Total Value Locked (TVL) | $1.749B |
Circulating Supply | 748.1M |
Total Supply | 1B |
Max Supply | 1B |
Total Treasury Holding | 562,535 |
Source: Data from CoinGecko as of September 13, 2026, at 3:21. Figures may vary slightly across other tracking websites.
LINK ETF Inflows Return: Crypto News Today
Crypto.news reported that Chainlink's spot ETFs, Bitwise's CLNK and Grayscale's GLNK, returned to positive flows after a quiet start to September, recording $1.09 million in inflows on September 9 and another $4.27 million on September 10.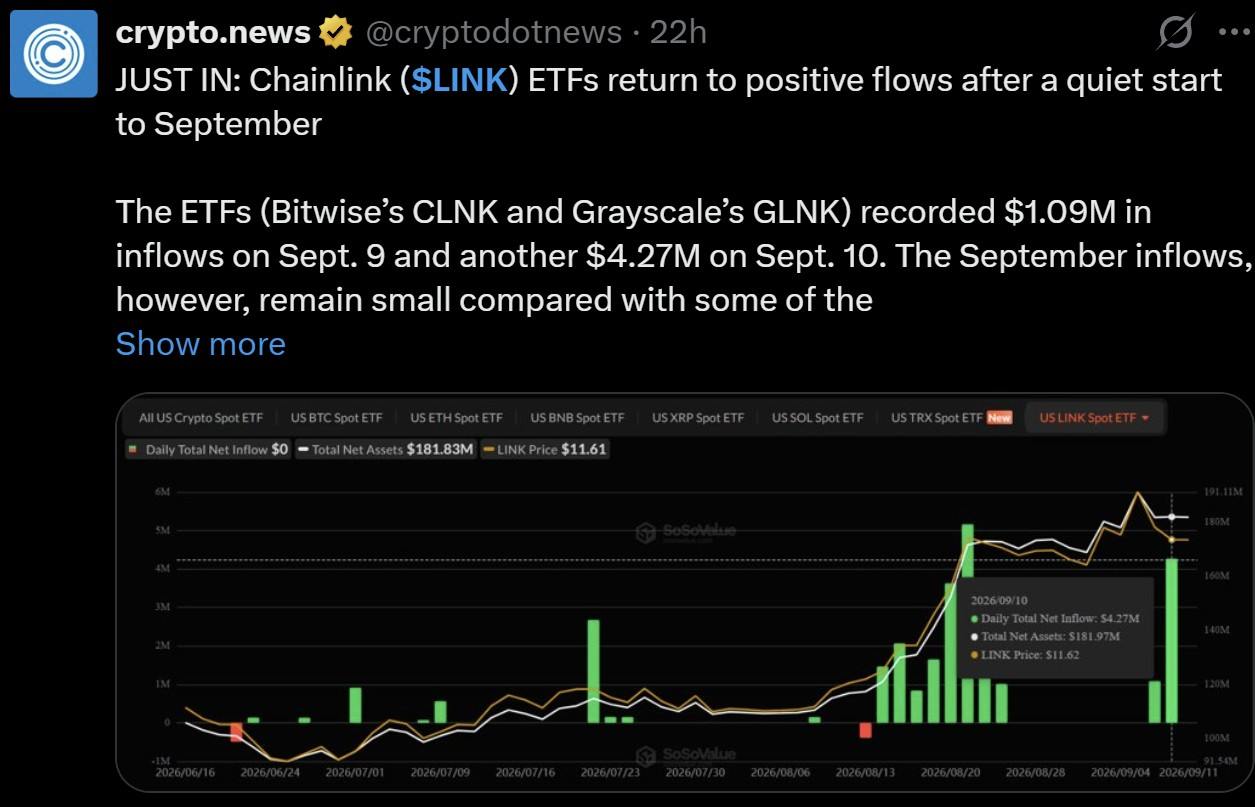
The post noted these September inflows are still small compared to earlier, stronger periods.
Chainlink's Reserve Buyback Adds to Bullish Buzz
BSCN reported that Chainlink's latest reserve purchase added roughly 91,100 $LINK tokens, pushing its official reserve to nearly $68 million in dollar value. 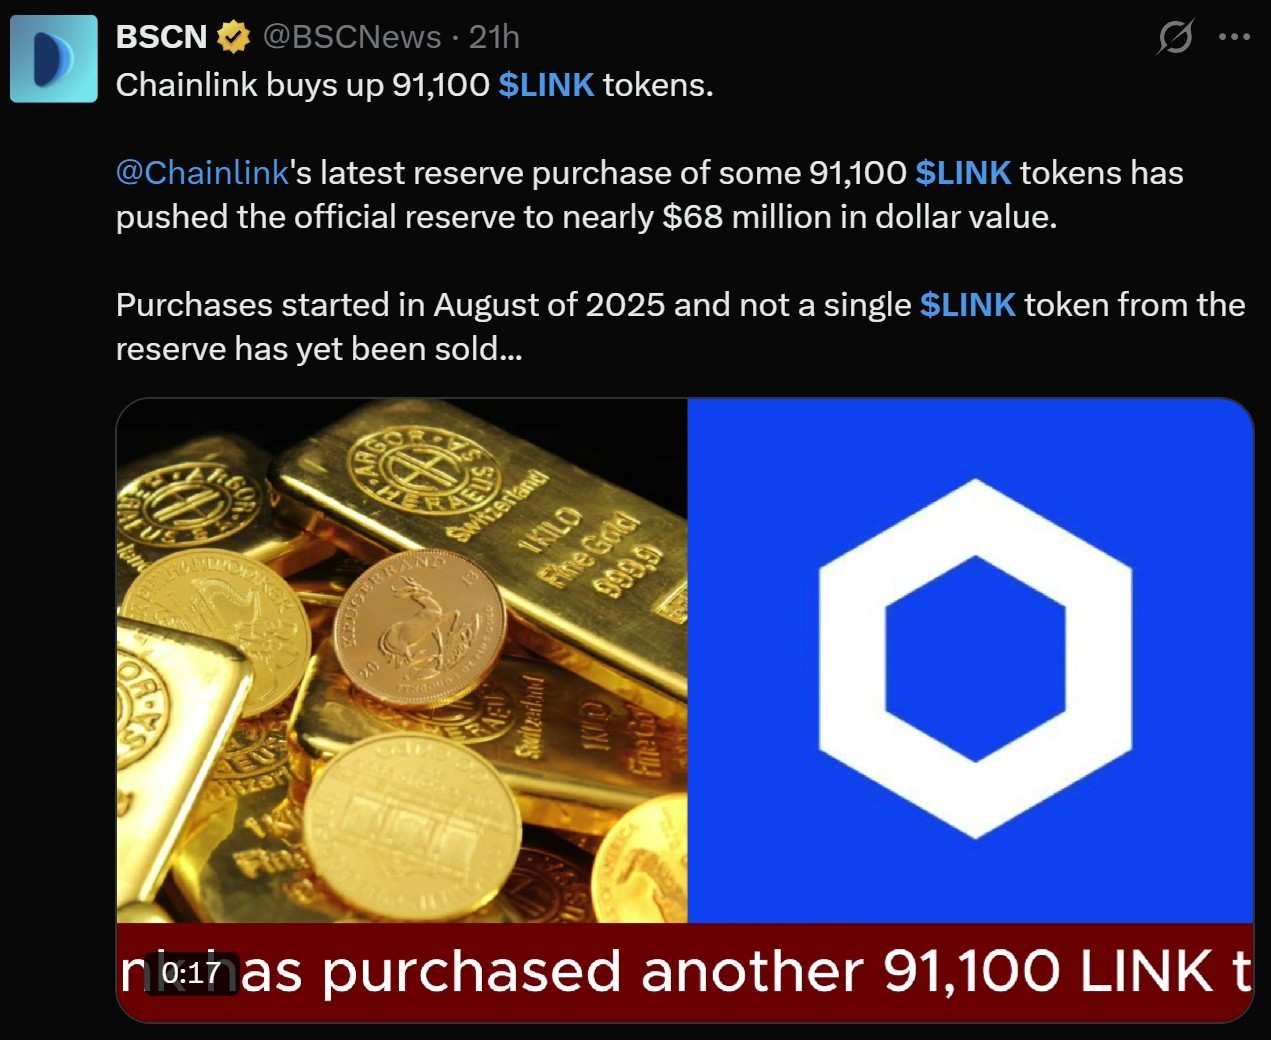
Purchases reportedly began in August 2025, and not a single $LINK token from the reserve has been sold since.
$LINK Price Prediction Chart: Chainlink Technical Analysis
Pair: LINK/USDT · Market: Spot · Exchange: OKX · Timeframe: 1D · Timestamp: September 13, 2026, 07:37 UTC-3
$LINK trades at $11.353, down 1.35% on the candle, cooling off from a sharp September spike toward $13.25 back toward its EMA cluster.
RSI (14, Relative Strength Index) sits at 50.92, right at the neutral midline after easing from stronger readings during the spike.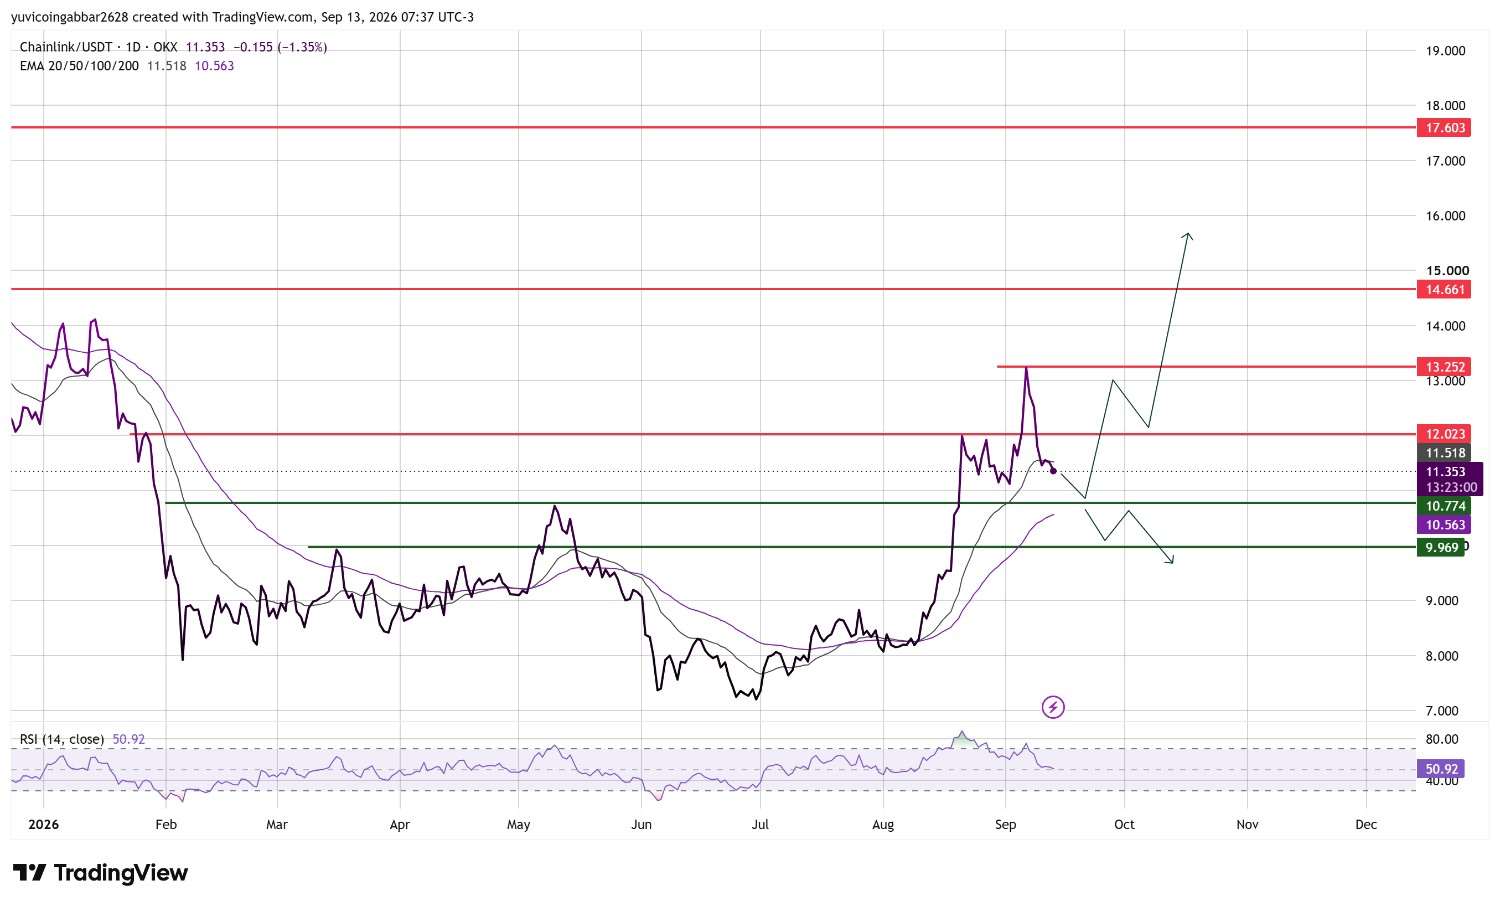
$LINK Key Levels to Watch: Chainlink Outlook
Level Type | Price |
Resistance 4 | $17.603 |
Resistance 3 | $14.661 |
Resistance 2 | $13.252 |
Resistance 1 (nearest) | $12.023 |
Immediate Price Reference | $11.353 |
First Confirmed Support | $10.774 |
Deeper Support | $9.969 |
Chainlink Forecast: Bull Case vs Bear Case
Bull case: Reclaiming the EMA cluster near $11.518 and clearing $12.023 would open the path toward $13.252 and then $14.661, with ETF inflows and the ongoing reserve buyback both adding to demand.
Bear case: A close below $10.774 would expose the longer EMA near $10.563 and then $9.969, unwinding most of the September spike even with the buyback and ETF story intact.
Chainlink News: $LINK Triggers and Invalidation
Scenario | Trigger | Likely Outcome | Invalidation Point |
EMA reclaim | Close above $11.518 | Push toward $12.023 | Rejection back below $11.353 |
Support hold | Bounce from $10.774 | Range continues toward resistance | Close below $10.774 |
Support breakdown | Close below $10.563 | Slide toward $9.969 | Reclaim of $10.774 |
Chainlink Future Price: Can LINK 20X From Here?
A 20x from today's $11.353 would put LINK near $227, implying a fully diluted valuation of roughly $227 billion, more than 20 times its current $11.352 billion FDV.
That would require Chainlink to grow into one of the largest crypto assets by market cap, well beyond where it sits today.
The ETF inflows and reserve buyback are genuinely positive signals, but neither changes that math in the near term, and nothing on the current chart points anywhere close to that level.
A 20x would be a multi-year, best-case scenario at most, not something the resistance levels above are signaling.
Chainlink Price Prediction 2026: Expert View
According to CoinGabbar analysts, ETF inflows and the reserve buyback are real, steady positives, but LINK still needs to clear $12.023 to confirm the September spike wasn't a one-off.
The $10.774 to $12.023 zone is what matters most this week.
Disclaimer
This piece is for informational purposes only and isn't financial advice. The levels and scenarios above are based on technical chart analysis and publicly available data at the time of writing, and crypto markets can move sharply within hours, so past patterns don't guarantee future outcomes. It's worth doing independent research and considering your own risk tolerance before acting on any of the levels discussed here.
0
0

 すべての暗号通貨、NFT、DeFiを1か所から管理
開始に使用しているポートフォリオを安全に接続します。


