
Monero Price Prediction August 2026: $XMR Scenario Analysis, What Next

0
0

XMR has just broken above a multi-month descending trendline, and the liquidation data backs up the shift; the last 24 hours have seen far more shorts get flushed out than longs.
Monero is a privacy-focused cryptocurrency that uses ring signatures and stealth addresses to obscure transaction details, according to its own project materials.
This Monero Price Prediction August 2026 runs through a scenario analysis of whether XMR holds its new ascending channel above $335.57 over the next one to two weeks, a setup that would be invalidated by a confirmed close below that level.
Here's the full breakdown.
Monero Price Prediction Today: Market Overview and XMR Price Movement
Metric | Value |
Price | $352.47 |
24h Change | −0.67% |
Market Cap | $6.62B (−0.67%) |
24h Volume | $103.2M (+3.69%) |
Vol/Mkt Cap (24h) | 1.55% |
FDV | $6.62B |
Total Supply | 18.78M XMR |
Max Supply | ∞ (uncapped) |
Circulating Supply | 18.78M XMR |
Source: Data from CoinMarketCap as of 31/07/2026. Figures may vary slightly across other tracking websites.
XMR Liquidation and Volume Data
Monero's futures market shows a clear shift in direction over the past day, per Coinglass: the 1h and 4h windows saw liquidations concentrated entirely on longs ($1.20K and $1.28K respectively, with $0 in shorts).
But the 12h and 24h windows flip that pattern: 24h liquidations total $19.46K, split $3.38K longs versus $16.08K shorts. 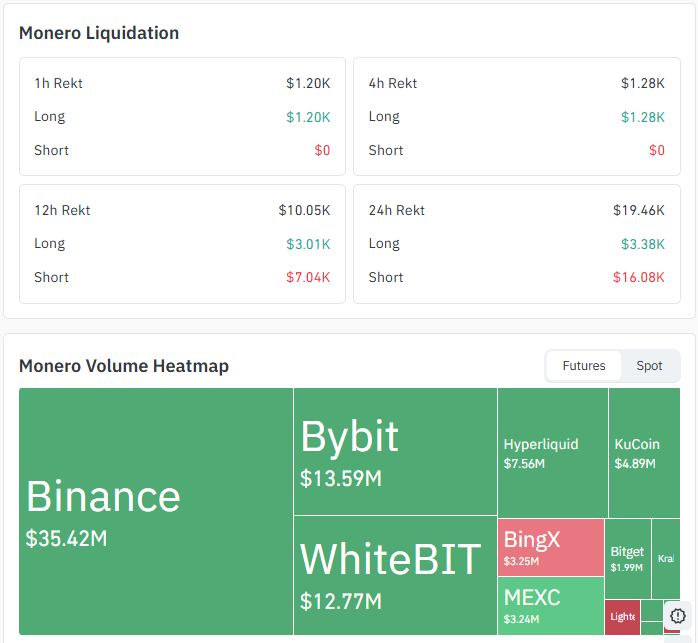
Source: Data From CoinGlass
That flip points to a short squeeze during the recent bounce, with leveraged short sellers getting forced out as price pushed higher.
On the futures volume side, Binance ($35.42M) leads by a wide margin, followed by Bybit ($13.59M) and WhiteBIT ($12.77M), with smaller volume spread across Hyperliquid, KuCoin, BingX, MEXC, and Bitget.
This futures data is kept separate from the $103.2M spot volume figure in the market overview above.
Monero Prediction Chart: Technical Analysis
Pair: XMR/USD · Market: Spot (Crypto) · Timeframe: 1D · Source: TradingView · Timestamp: July 31, 2026, 12:18 UTC+5:30
XMR trades at $352.47, just broken above the descending trendline that capped every rally since the May high near $418.
Since that breakout, the price has consolidated inside a small ascending channel roughly between $335 and $360 and is currently testing the lower boundary of that channel.
Separately from the resistance levels below, the EMA 20 ($345.41) and EMA 50 ($340.93) EMA (exponential moving average) readings that weight recent price action more heavily than a simple average now sit just under the current price.
Having already been reclaimed, they're acting as a support above the current price. floor rather than as overhead resistance.
If the price breaks the ascending channel to the downside, it could retest the EMA 20 and EMA 50 on the way down and continue falling from there
if instead the price holds above these EMAs and the channel, that would support the case for a continued trend change following the channel breakout.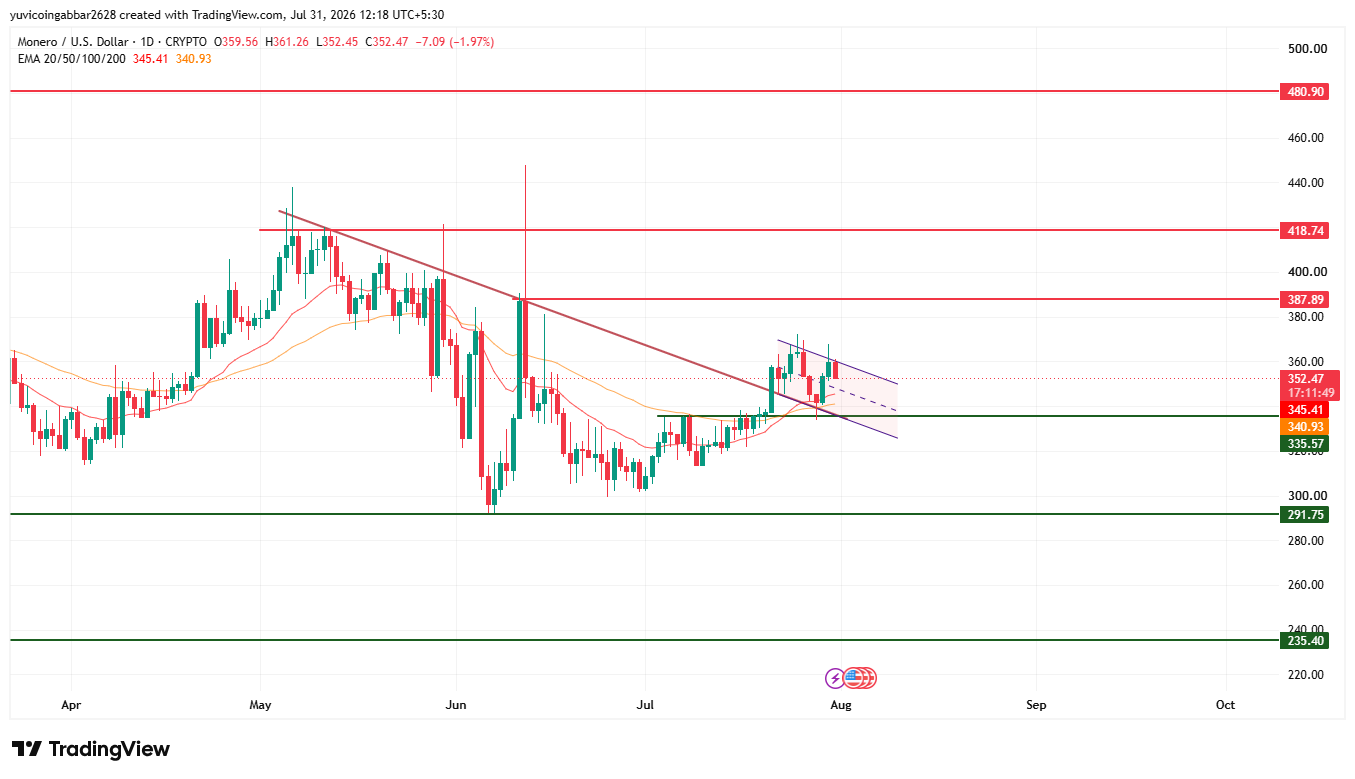
Level Type | Price |
Resistance 3 | $480.90 |
Resistance 2 | $418.74 |
Resistance 1 | $387.89 |
Immediate Price Reference | $352.47 |
First (channel floor) | $335.57 |
Support | $291.75 |
Deeper Support | $235.40 |
EMA 20 ($345.41) and EMA 50 ($340.93) sit between the immediate price reference and the first confirmed support, both already reclaimed and acting as a support cushion, separate from the resistance zone above.
Monero Forecast August 2026: Bull Case vs. Bear Case
Bull case: If XMR holds above the channel floor at $335.57, with the reclaimed EMA 20 ($345.41) and EMA 50 ($340.93) acting as a cushion underneath, the next target is $387.89, with a stretch toward $418.74 if the trendline breakout extends further.
The recent shift toward short-side liquidations supports this near-term bullish tilt.
Bear case: A confirmed break below $335.57 and a loss of the EMA 20/50 cushion would signal the ascending channel has failed, opening a retest of $291.75, with $235.40 as the deeper level below that.
The earlier long-side liquidations in the 1h and 4h windows show leveraged longs already got flushed once during this move, so a renewed leg down wouldn't be unprecedented.
Can XMR Reach the Monero Price Target of $418.74?
A move to $418.74, a stretch beyond the base bullish target, would require XMR to first clear $387.89 and hold above it on a sustained basis.
That's a bigger ask than the near-term bull case above and would effectively mean price reclaiming the same zone that capped its last major rally back in May.
What Could Invalidate the XMR Bullish Forecast?
A confirmed daily close below $335.57 would undercut the near-term recovery case and signal the ascending channel has failed.
A further break below the EMA 20/50 cushion at $345.41/$340.93 would add to that signal, opening room toward $291.75 and eventually $235.40 if the breakdown continues.
XMR Short-Term Forecast: A Liquidation-Based Read
The swing from almost entirely long-side liquidations in the 1h and 4h windows to overwhelmingly short-side liquidations over 12h and 24h, per Coinglass, suggests the market has been actively repricing after the trendline breakout short sellers who bet on the downtrend continuing got squeezed as price broke higher.
That's a supportive signal for the near-term bull case, though it doesn't guarantee the ascending channel holds on its own.
Monero Price Prediction Methodology
This forecast draws on multiple inputs rather than a single chart pattern: market structure around the trendline breakout, the support and resistance levels on the daily chart, EMA positioning relative to price, the shape of recent liquidation activity, and the broader chart context. No single data point is treated as decisive on its own.
Monero Price Prediction August 2026: Expert View
According to CoinGabbar analysts, XMR's chart shows a genuine structural shift, a break above a multi-month descending trendline followed by consolidation in a tight ascending channel, with both the EMA 20 and EMA 50 already reclaimed underneath the current price.
The liquidation data adds weight to this shift, with short sellers taking the bulk of recent forced closures rather than longs.
The near-term question is whether $335.57 holds as the channel floor or whether the move fades back into the prior downtrend.
Monero Price Prediction August 2026: Data Sources
Price, market cap, and supply data referenced from a CoinGecko-style tracker, snapshot taken July 31, 2026. Liquidation and futures volume data referenced from Coinglass, as of July 31, 2026. Chart analysis (EMA, support/resistance, trendline) sourced from a 1D XMR/USD chart on TradingView, timestamped July 31, 2026, 12:18 UTC+5:30.
Disclaimer: This piece is for informational purposes only and isn't financial advice. Crypto prices are volatile, and it's worth doing independent research before acting on any of the levels discussed here.
0
0

 Manage all your crypto, NFT and DeFi from one place
Securely connect the portfolio you’re using to start.

0
0

0
0

0
0
