
Dogecoin Price Prediction: DOGE ETFs See $419K Inflow Boost

0
0
Dogecoin started as a joke back in 2013, built around the Shiba Inu meme, but it's grown into one of the most actively traded cryptocurrencies around, largely thanks to a massive and vocal community.
There's no hard supply cap on DOGE, which sets it apart from many other major tokens. Right now, this Dogecoin price prediction places the coin at $0.08558, down 1.7% over the past 24 hours.
Market cap comes in near $13.332 billion, with roughly 155.78 billion DOGE in circulation.
Dogecoin Live Market Data
Metric | Value |
Current Price | $0.08558 |
24h Change | -1.7% |
24h Range | $0.08388 - $0.08826 |
Market Cap | $13.332B |
Fully Diluted Valuation | $13.332B |
24h Trading Volume | $835.741M |
Circulating Supply | 155.78B |
Total Supply | 155.787B |
Max Supply | Unlimited |
Source: DOGE market cap data taken from CoinGecko, data as of Sep 05, 2026. Figures may vary slightly across other tracking websites.
Dogecoin Liquidation Snapshot
Shorts got squeezed hard in the shorter timeframes, but the 24-hour picture flips things around, with longs absorbing the bigger hit overall.
Timeframe | Total Liquidated | Long | Short |
1h | $731.91 | $0 | $731.91 |
4h | $141.71K | $76.59K | $65.12K |
12h | $161.03K | $93.36K | $67.67K |
24h | $3.87M | $3.45M | $423.67K |
Source: Liquidation Data Taken From CoinGlass, As of Sep 5, 2026
Exchange Volume
Binance holds a commanding lead in Dogecoin trading volume, well ahead of OKX and Bybit.
Exchange | Volume |
Binance | $533.12M |
OKX | $284.22M |
Bybit | $148.82M |
WhiteBIT | $85.30M |
Bitget | $83.90M |
Gate | $61.05M |
MEXC | $50.28M |
Bitunix | $39.94M |
KuCoin | $28.34M |
Source: Volume Heatmap Data Taken From CoinGlass, As of Sep 5, 2026
Dogecoin News Today
Dogecoin ETFs appear to be finding their footing again. A report highlighted a $419,000 net inflow into spot $DOGE ETFs on September 3, marking three consecutive days of positive flows something these products haven't managed since May.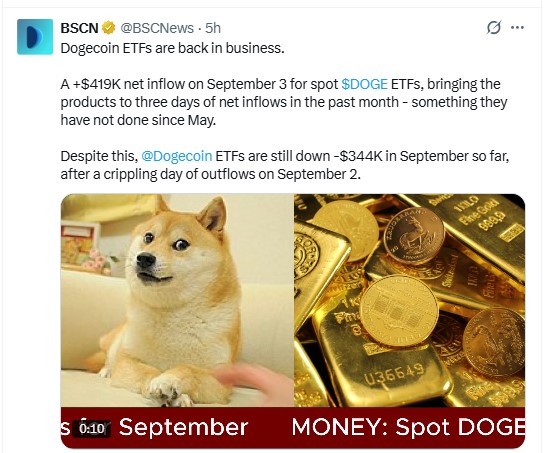
Source: Data Taken From @BSCNews, X Account, As of Sep 05, 2026
That streak matters, since it suggests institutional interest hasn't fully dried up despite a choppy few months for the category.
That said, the recovery is far from complete. The same report noted that DOGE ETFs remain down $344,000 for September overall, a hole dug largely by a heavy outflow day on September 2.
So while the recent Dogecoin news around inflows is encouraging, it's still playing catch-up rather than showing a clean turnaround.
Technical Analysis: Dogecoin Price Prediction Outlook
DOGE's 4-hour chart tells a structural story. Price had been sliding inside a descending channel, but it broke above that channel's upper boundary and flipped into a new ascending channel.
Since then, the price has pulled back to test a support zone within this fresh structure.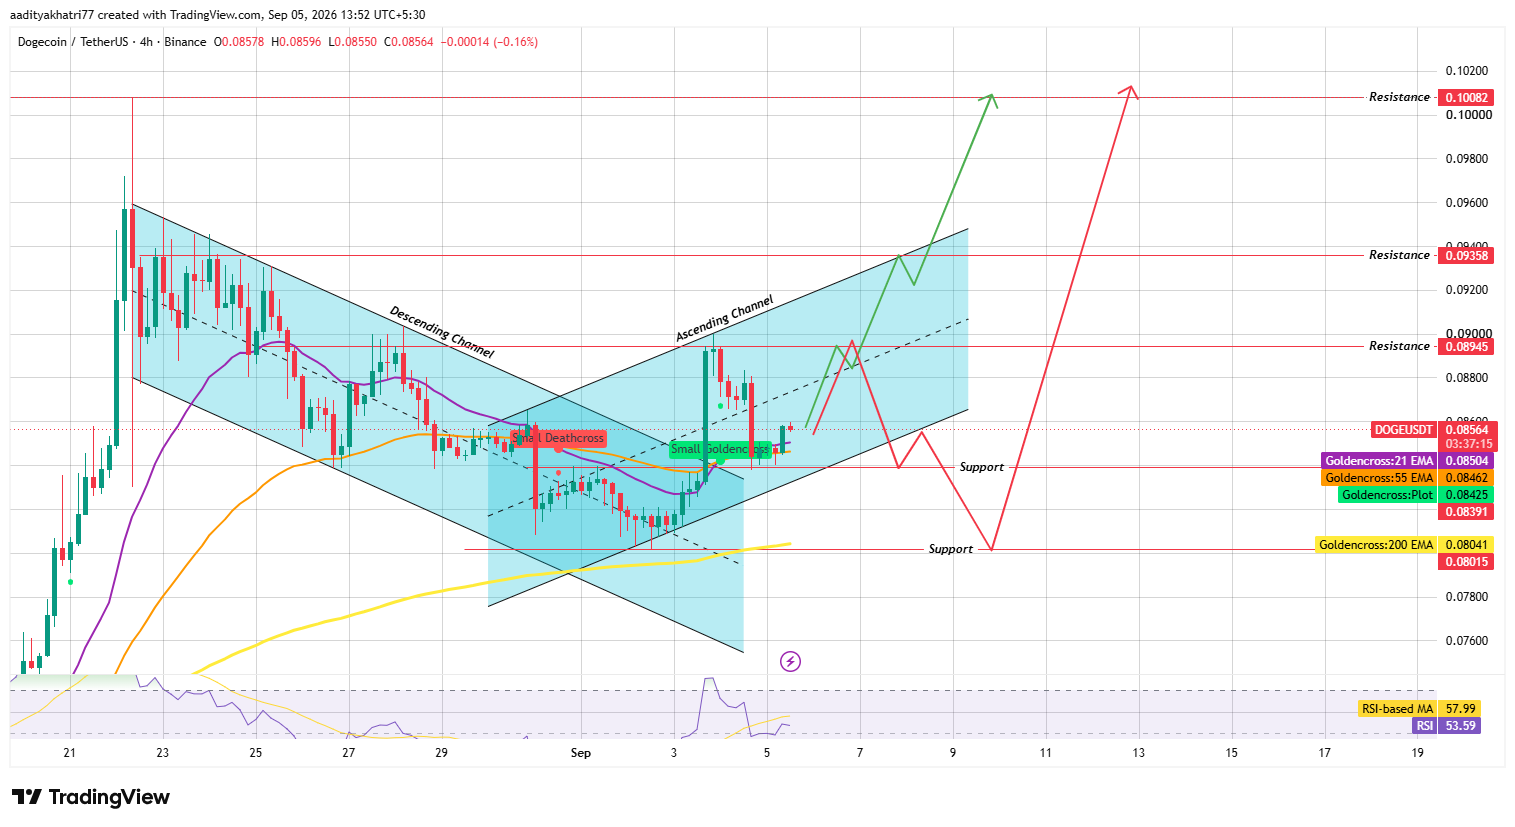
Source: Chart Taken From TradingView, As of Sep 5, 2026
From here, the setup splits two ways. If volume picks up and price bounces off support, the first hurdle is the $0.08945 resistance level.
Break through that and then clear the ascending channel's upper boundary, and $DOGE opens a path toward $0.09358, with $0.10082 as a further target if momentum holds.
Go the other direction, though, and a rejection at resistance combined with a failed support test could send the price lower.
In that case, DOGE risks sliding back toward the $0.08041–$0.08015 zone, where the 200 EMA and a key support level converge.
Support & Resistance Levels
Type | Level |
Resistance 3 | $0.10082 |
Resistance 2 | $0.09358 |
Resistance 1 | $0.08945 |
Support 1 | $0.08391 |
Support 2 | $0.08015 |
EMA Levels (4H Chart)
EMA | Price |
21 EMA | $0.08504 |
55 EMA | $0.08462 |
200 EMA | $0.08041 |
RSI sits at 53.59 right now, just above neutral, while the RSI-based moving average reads a touch higher at 57.99.
Momentum looks like it's cooled off from a recent push but hasn't tipped into bearish territory.
Glossary
A descending channel traps the price between two parallel downward-sloping lines, with lower highs and lower lows defining the trend until something breaks it.
Flip that structure and you get an ascending channel support and resistance, both trending upward, and the price bounces along the way as the broader move climbs.
A small death cross shows up when a shorter moving average dips below a longer one on a minor scale, often just a short-term caution flag rather than a full trend reversal.
A small golden cross is the reverse of a brief bullish signal as the shorter average crosses back up.
Liquidation refers to a leveraged position getting force-closed once losses eat through the available margin.
DOGE vs Bitcoin
DOGE's channel flip and its ETF inflow news both look like developments specific to Dogecoin rather than something tied to Bitcoin's own chart.
Bitcoin price today doesn't explain why DOGE broke its descending channel, and it doesn't explain the ETF flow data either.
Because of that, this Dogecoin price prediction leans more heavily on DOGE's own technical structure and ETF-related Dogecoin news than on any Bitcoin price prediction currently circulating in the broader market.
Expert Opinion
Traders watching DOGE's recent structure shift point out that a channel flip paired with a support retest is a fairly common setup before a decisive move, especially when it lines up with fresh capital returning through ETF products.
That combination of technical structure plus renewed inflows is often what analysts watch for when gauging whether a recovery has real legs or is just a short-term bounce.
Disclaimer: This Dogecoin price prediction is based on technical chart analysis and current market data and should not be treated as financial advice. Cryptocurrency markets are highly volatile, and actual price movements may deviate significantly from projected scenarios. Support and resistance levels discussed represent probability zones, not guaranteed outcomes, and downside risk exists at every stage of this analysis. Readers should conduct independent research before making investment decisions.
0
0


 Управляйте всей своей криптовалютой, NFT и DeFi из одного места
Безопасно подключите используемый вами портфель для начала.


