
Polkadot Price Prediction: $DOT $140M Volume, All-Time-High IMP Level?

0
0

$DOT just broke above the descending trendline it had been stuck under since May, and trading volume is spiking right along with it.
This Polkadot price prediction looks at whether the breakout has enough behind it to keep climbing and which levels matter most if it does.
Market data was checked on September 7, 2026, at 05:39 UTC-3.
Polkadot Price Prediction Today: Market Overview
Metric | Value |
Price | $0.96962 |
24h Change | +4% |
Market Cap | $1.65B |
FDV | $2.03B |
24h Volume | $201.7M |
Vol/Mkt Cap (24h) | 12.23% |
Total Supply | 1.7B DOT |
Max Supply | 2.1B DOT |
Circulating Supply | 1.7B DOT |
Source: Data from CoinMarketCap as of September 7, 2026, at 05:39 UTC-3. Figures may vary slightly across other tracking websites.
Polkadot News Today: Volume Surpasses $140M
Source: Data From X
Crypto account @criptoovar flagged that Polkadot crossed $140M in 24-hour trading volume, calling it a notable spike worth watching.
CoinGabbar could not independently verify the exact figure beyond this social media post.
Polkadot Liquidation and Volume Data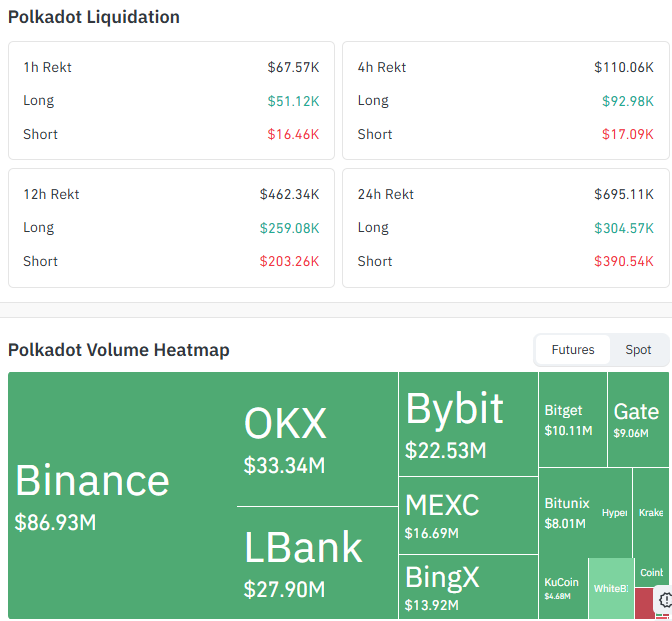
Futures data from Coinglass shows liquidations picking up as DOT broke its downtrend:
Timeframe | Total Liquidated | Longs | Shorts |
1h | $67.57K | $51.12K | $16.46K |
4h | $110.06K | $92.98K | $17.09K |
12h | $462.34K | $259.08K | $203.26K |
24h | $695.11K | $304.57K | $390.54K |
Longs took the bigger hit over 1h and 4h as the price pulled back from its breakout spike, while shorts saw more pressure over the 12h and 24h windows.
On the futures volume side, Binance leads with $86.93M, followed by OKX at $33.34M, LBank at $27.90M, Bybit at $22.53M, MEXC at $16.69M, BingX at $13.92M, Bitget at $10.11M, Gate at $9.06M, Bitunix at $8.01M, and KuCoin at $4.68M.
This futures activity is separate from DOT's CoinGecko spot volume figure above.
DOT Price Prediction Chart: Technical Analysis
Pair: DOT/USD · Market: Spot (Crypto) · Timeframe: 1D · Source: TradingView · Timestamp: September 7, 2026, 15:20 UTC+5:30
DOT is trading at $0.96962, after breaking above a descending trendline that had capped the price since early May.
The breakout candle spiked sharply above $1.00 before pulling back, and the price is now consolidating just under the $1.01299 level after the move.
The EMA cluster sits well below the current price, with the 20 EMA at $0.88171 and the 50 EMA at $0.86395, both now acting as support well beneath the recent breakout.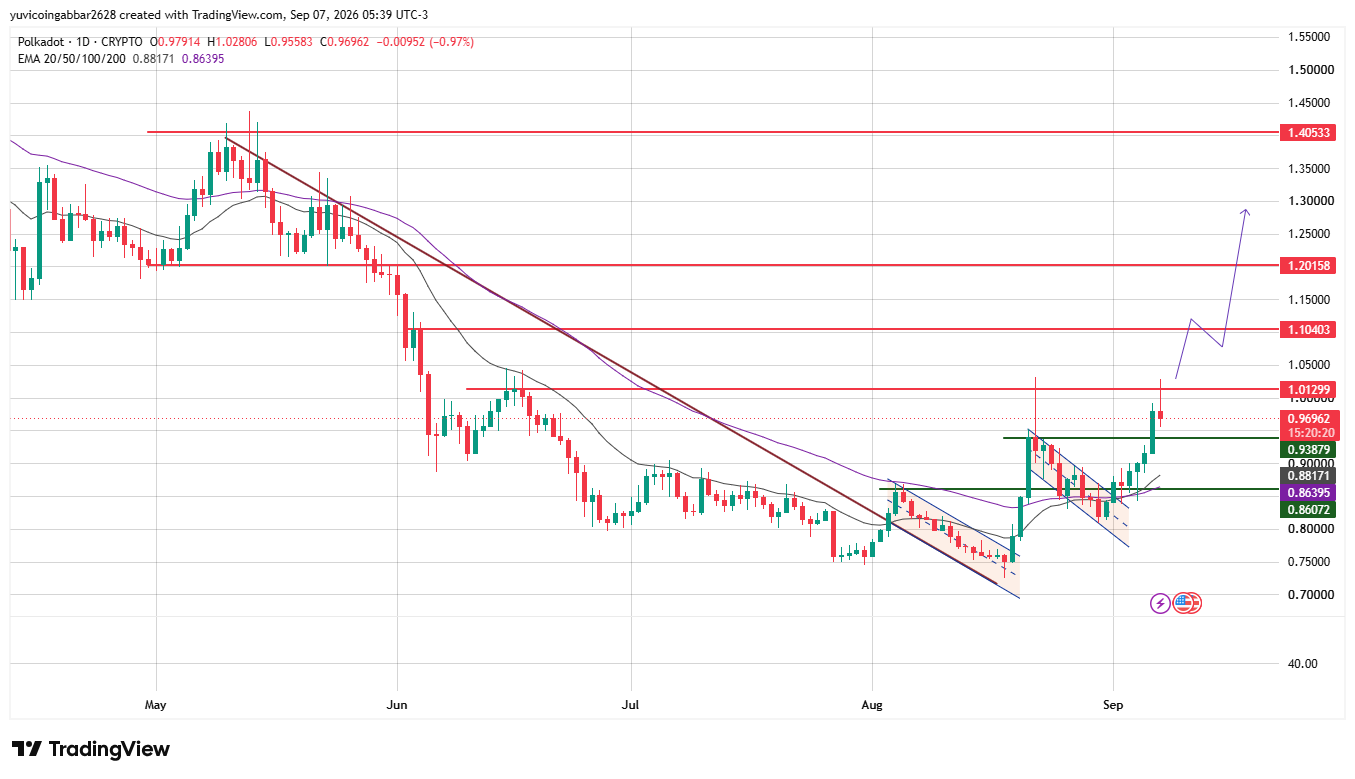
Support and Resistance Levels
Level Type | Price |
Resistance 3 | $1.40533 |
Resistance 2 | $1.20158 |
Resistance 1 (nearest) | $1.10403 |
Immediate Price Reference | $1.01299 |
Current Price | $0.96962 |
First Confirmed Support | $0.93879 |
Deeper Support | $0.86072 |
Polkadot Forecast: Bull Case vs Bear Case
Bull case: Holding above $0.93879 and reclaiming $1.01299 would confirm the trendline breakout is holding, opening the path toward $1.10403 and eventually $1.20158.
Bear case: A close back below $0.93879 would put the breakout in doubt and suggest the move was a temporary spike. Losing $0.86072 would expose DOT to a retest of the EMA cluster near $0.88171 to $0.86395.
Scenarios, Triggers, and Invalidation
Scenario | Trigger | Likely Outcome | Invalidation Point |
Trendline reclaim (bullish) | Hold above $0.93879 and break $1.01299 | Push toward $1.10403 | Close below $0.93879 |
Range hold | Consolidation between $0.93879 and $1.01299 | Sideways chop before next leg | Break of either bound |
Breakdown (bearish) | Close below $0.93879 | Retest of $0.86072 | Reclaim above $1.01299 |
Can DOT Reach $1.40533?
$1.40533 is the highest resistance level marked on the chart.
Getting there would require DOT to first clear $1.01299, then $1.10403 and $1.20158, a multi-stage move that would need sustained volume well beyond the current spike to play out.
Polkadot Price Prediction 2026: Expert View
According to CoinGabbar analysts, The trendline break and the jump in trading volume both point to renewed short-term interest.
Whether it turns into a sustained move or fades back into the old downtrend depends on whether DOT can hold $0.93879 through the next few sessions.
Disclaimer: This piece is for informational purposes only and isn't financial advice. The levels and scenarios above are based on technical chart analysis and publicly available data at the time of writing, and crypto markets can move sharply within hours, so past patterns don't guarantee future outcomes. It's worth doing independent research and considering your own risk tolerance before acting on any of the levels discussed here.
0
0


 Manage all your crypto, NFT and DeFi from one place
Securely connect the portfolio you’re using to start.


