PEPE Price Soars 20%, Leads Market Rebound as Meme Coin Mania Returns
3h ago•

bullish:
0
bearish:
0
Share

The widespread market bounce has brought substantial gains for many altcoins. However, like in previous times, meme coins are leading this charge, with Pepe (PEPE) on the front foot today.
The frog-themed meme coin trades at $0.000011 at press time, representing a 20.13% increase in the last 24 hours. This on-chain analysis highlights the catalysts for the hike and potential price targets.
More Interaction, Higher Prices
According to Santiment, the price-DAA divergence is one reason PEPE’s price increased. DAA stands for Daily Active Addresses and measures unique user interaction with a cryptocurrency.
As seen below, the price-DAA divergence was negative during PEPE’s downtrend. This implies that participation was low as the price fell. But on July 11, things changed as PEPE’s price began to move northward.
Typically, higher prices attract more market participants to buy the crypto. Therefore, the rise to 64.29% proves that as active addresses increased, participants were influenced to value the meme coin higher and buy more.
Read More: 5 Best Pepe (PEPE) Wallets for Beginners and Experienced Users
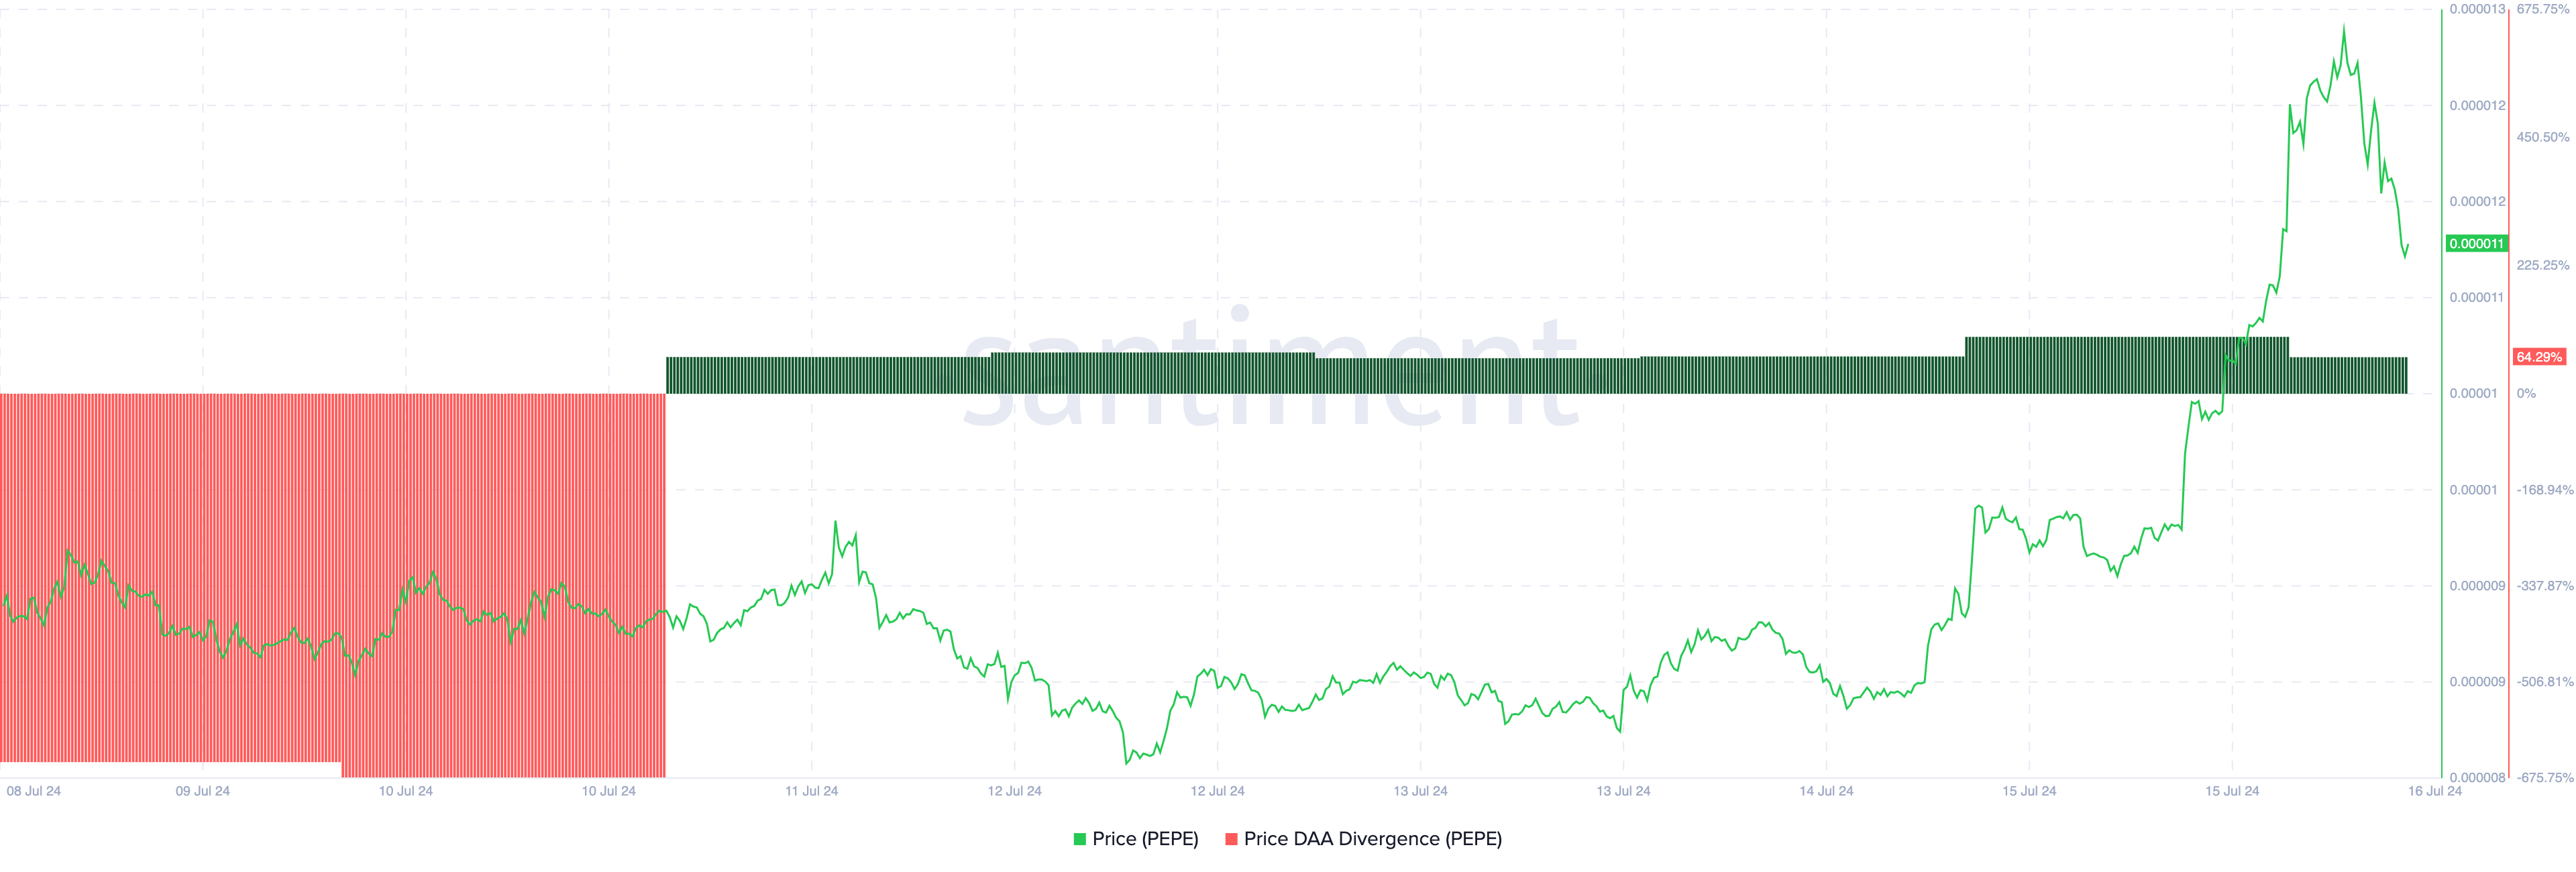 PEPE Price DAA Divergence. Source: Santiment
The rise in buying pressure is also reflected in the volume, which reached close to $2 billion for the first time in almost two months.
In crypto, volume refers to the value traded over a period of time. An increase implies that a higher number of participants are involved in trading the cryptocurrency. However, a decrease in volume indicates declining interest.
This metric also impacts price. For example, if the price is trending up and suddenly volume declines, it indicates that it could be time for a reversal. However, since PEPE’s volume continues to rise, the uptrend will likely continue.
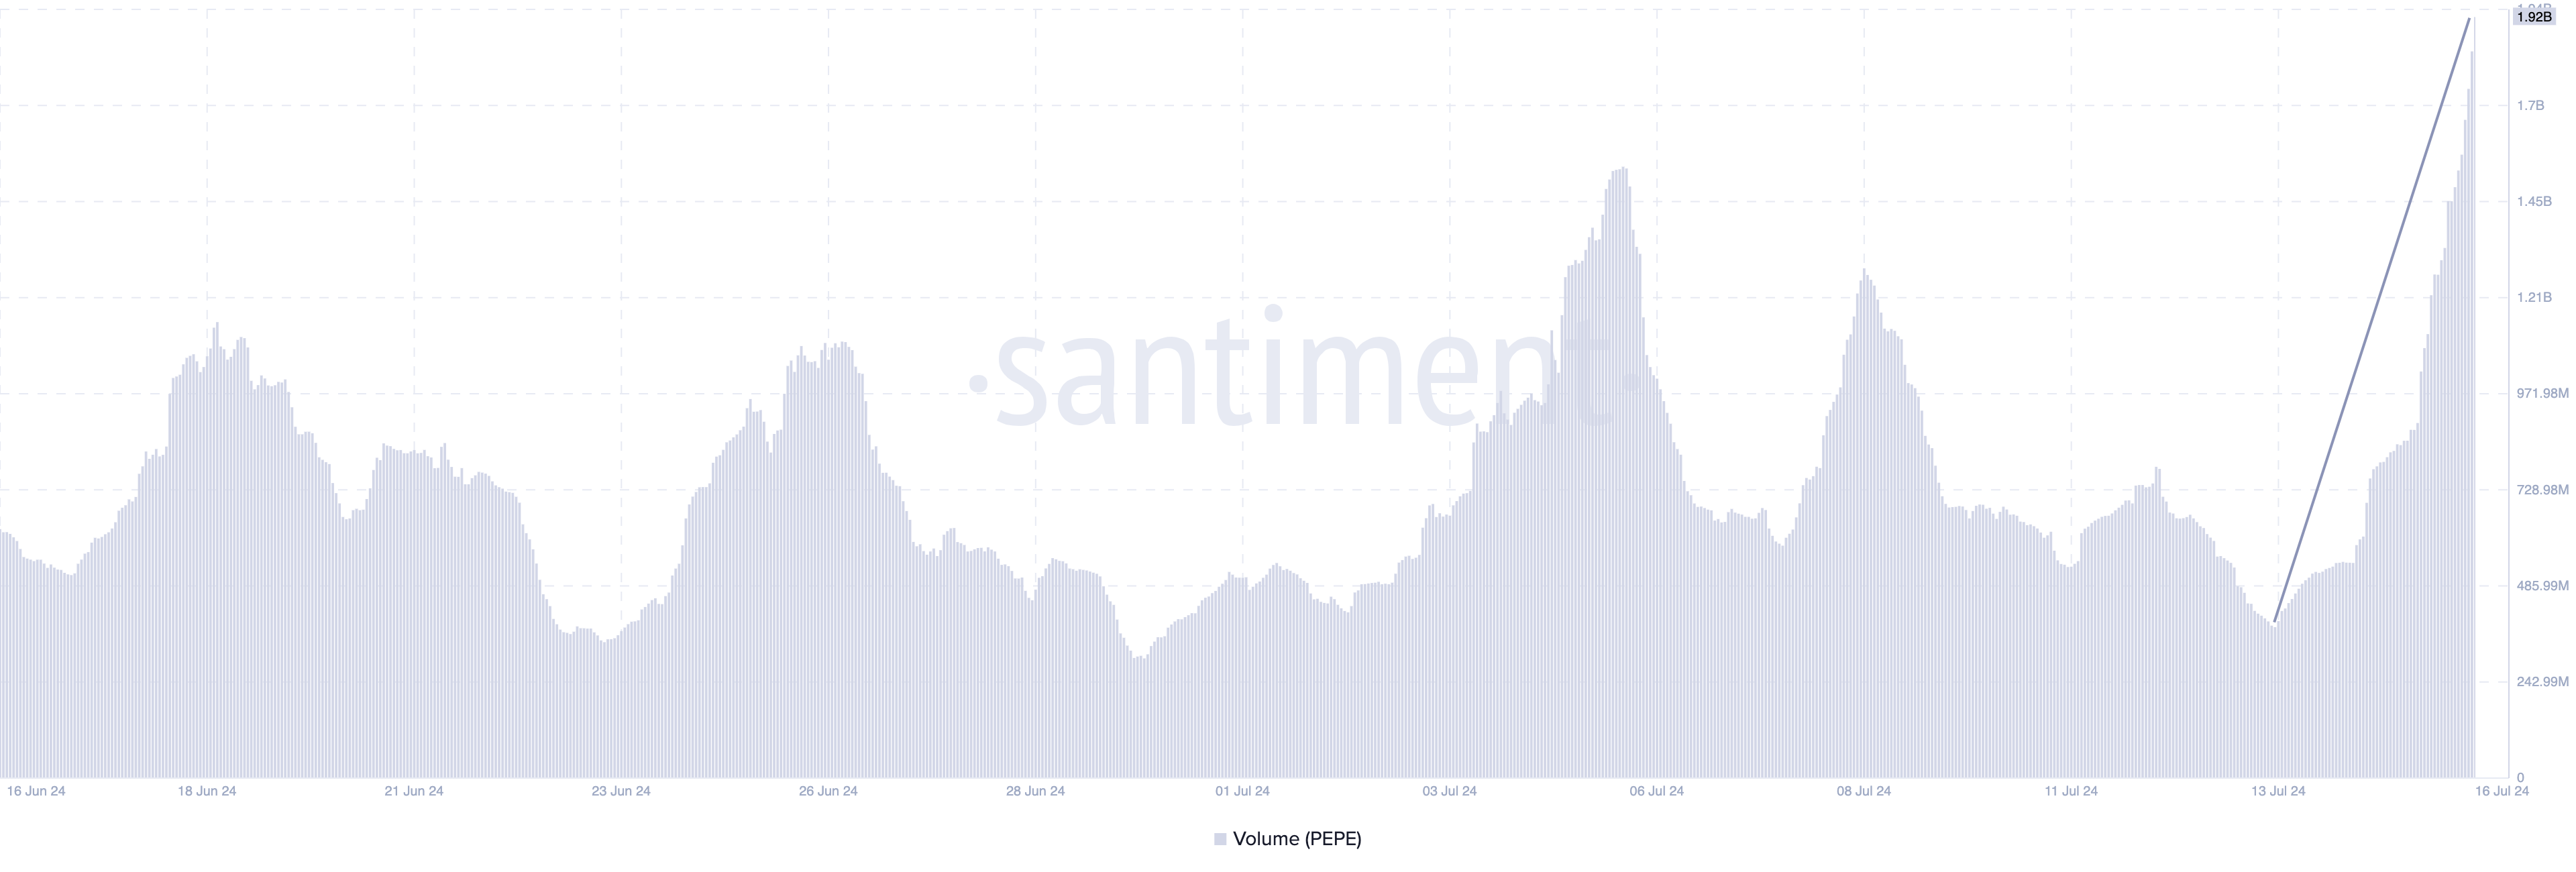 PEPE Volume. Source: Santiment
PEPE Price Prediction: Can It Climb Higher?
The daily PEPE/USD chart indicates that bullish momentum continues to build, as indicated by the Relative Strength Index (RSI).
By definition, the RSI measures momentum by measuring the size and speed of price changes. Traders also use this technical tool to spot overbought or oversold conditions. If the rating increases, momentum is bullish. However, the crypto has become overbought if it reaches 70.00 or above.
Conversely, a decrease in the RSI reading indicates bearish momentum. Likewise, a reading of 30.00 or below means it is oversold.
As stated earlier, the RSI at 60.10 indicates that the meme coin’s momentum is bullish. If sustained, this could give rise to higher prices spotted by the Fibonacci retracement indicator. This indicator provides insights into potential levels where the price can reach or is likely to reverse.
Read More: Litecoin: Pepe (PEPE) Price Prediction 2024/2025/2030
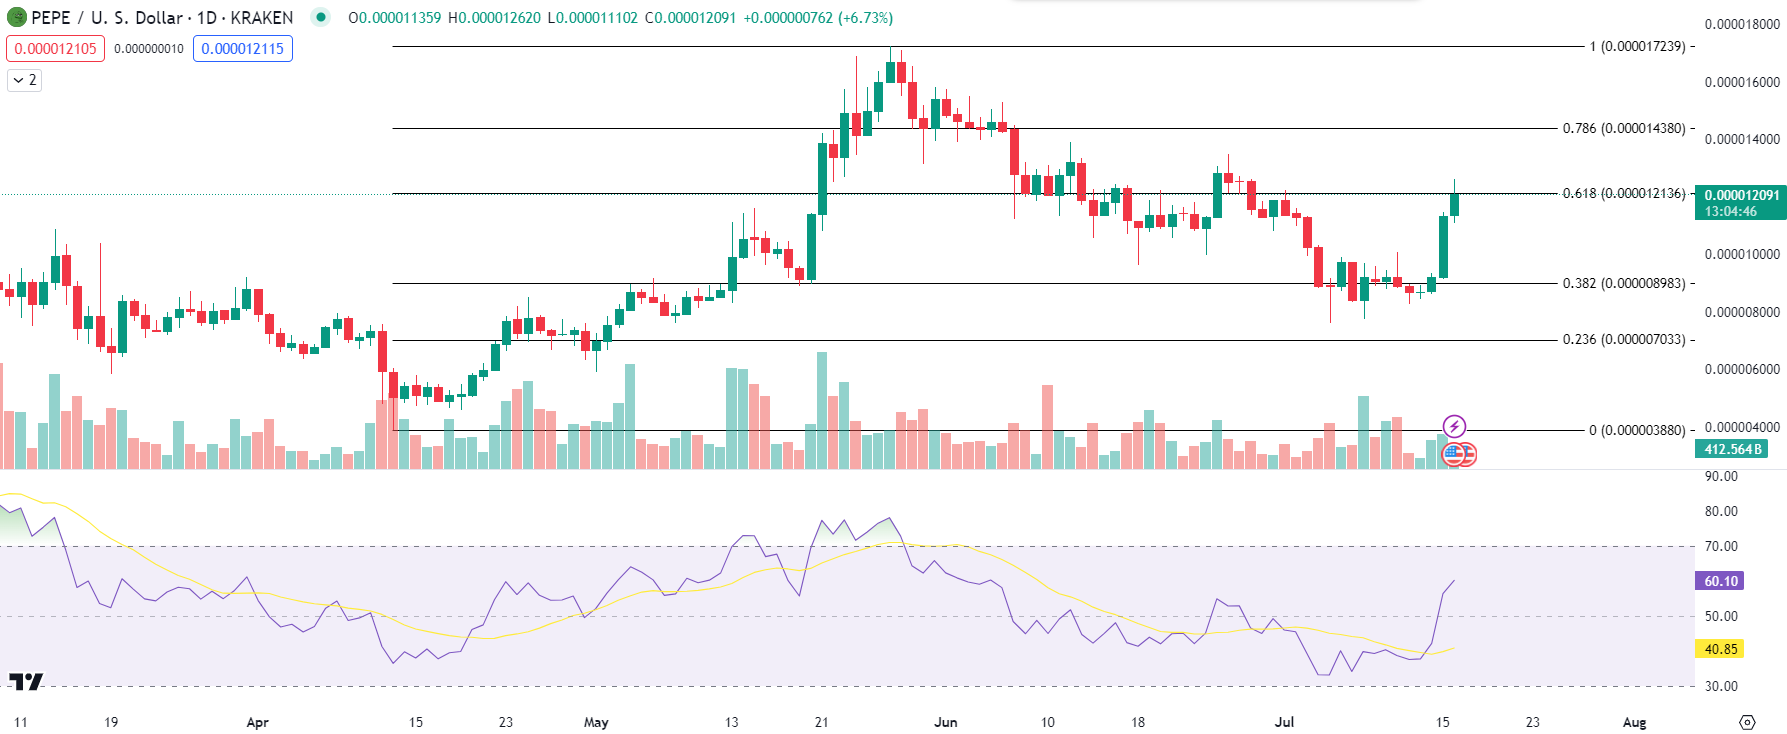 PEPE Daily Analysis. Source: TradingView
In addition, the important ones include the 0.236, 0.382, 0.618, and 0.786 Fibonacci levels. From the chart above, if buying pressure increases, PEPE’s next target could retest $0.000012 and probably jump to $0.000014.
However, if traders decide to book profits from the recent hike, the meme coin’s price may reverse to $0.000010.
3h ago•
bullish:
0
bearish:
0
Share


 Manage all your crypto, NFT and DeFi from one place
Securely connect the portfolio you’re using to start.

bullish:
0
bearish:
0

bullish:
0
bearish:
0

bullish:
0
bearish:
0

bullish:
0
bearish:
0