
Hyperliquid Price Prediction: Is HYPE Ready for $69?

0
0

Hyperliquid price prediction watchers are focused on a make-or-break moment right now, with HYPE trading just underneath the exact level that would confirm a breakout from its recent downtrend.
This is a 4-hour timeframe technical setup rather than a longer horizon forecast, and it should be read with that scope in mind.
The levels discussed below come from the 4-hour HYPE/USDT spot chart on Bitget and should be rechecked if the price closes meaningfully outside the range covered in this analysis.
In this article: Key Takeaways, HYPE Price Right Now, Methodology, JPMorgan vs Bitwise Debate, ETF Flow Data, Liquidation Snapshot, Chart Analysis, Long-Term Targets, Technical Snapshot, Support and Resistance, Risk-Reward, What Would Change This Prediction, Bitcoin Sentiment Link, Update Trigger, Glossary, Bull/Base/Bear Case, Disclaimer.
Hyperliquid Trend and Momentum: Key Takeaways
HYPE is trading around 54.190 dollars, the current market price, up about 0.11% on the 4-hour candle
Price has broken its descending trendline but is still trading below the confirmation level needed to validate that breakout
A close above 58.545 confirms a breakout toward 62.587 and 69.027, with 73.075 and 76.990 as longer term targets
A close below 52.637 would invalidate the trendline breakout, shifting focus toward 51.083 as the next support
The chart's momentum oscillator has repeatedly flashed Bull signals near recent pullback lows and now reads 43.67
HYPE spot ETF products have logged positive net inflows on most days over the past week, alongside a fresh debate over Hyperliquid's competitive position
CMP in this article refers to the current market price, the live price HYPE was trading at when this chart and data were captured.
Rekt, used in the liquidation section below, is common trading shorthand for the total dollar value of positions forcibly closed out.
These figures reflect a single snapshot in time and should be treated as reference points rather than fixed guarantees.
Hyperliquid Price Right Now
Metric | Value |
Price (CMP) | $54.190 |
24H Change | -0.95% |
Futures Volume (24H) | $984.28M |
Spot Volume (24H) | $38.32M |
Market Cap | $13.71B |
Open Interest | $2.23B |
Circulating Supply | 252.71M HYPE |
Total Supply | 952.73M HYPE |
Max Supply | 952.73M HYPE |
Open interest is the total value of open futures contracts that have not yet been settled, and a reading near 2.23 billion dollars shows there is heavy leveraged positioning built up around HYPE right now, well above what smaller cap coins typically carry.
Volume, open interest, and liquidation figures below are CoinGlass's aggregated market-wide data across tracked exchanges, not limited to a single venue like Bitget.
Chart source: TradingView, HYPE/USDT Spot 4-hour, Bitget (chart as supplied for this analysis), captured August 10, 2026, 11:48 IST (06:18 UTC). Market data source: CoinGlass Hyperliquid data page, captured August 10, 2026 (approximate same window).
Methodology and Data Sources
This Hyperliquid price prediction is built from a live 4-hour price chart with a hand marked descending trendline and breakout structure, plus real time market data, ETF flow data, and liquidation figures pulled from CoinGlass and CoinGlass's ETF tracking data.
No external analyst forecasts or projected price models have been added; the levels reflect only what the chart and data show at capture time. For HYPE's broader price hub and related coverage
JPMorgan vs Bitwise: The Debate Around Hyperliquid Right Now
A fresh piece of commentary is circulating around how traditional finance views Hyperliquid compared to how crypto-native firms view it.
platforms, framing it as a risk to watch. Bitwise, on the other hand, has reportedly floated a $150 price opportunity on the same asset.
The contrast highlights how differently institutional and crypto-native players are reading Hyperliquid's competitive position right now, even as both sides are looking at the exact same asset.
This kind of split narrative often adds to short-term volatility around HYPE as different investor bases react to conflicting takes.
Source: Hyperliquid Daily (@HYPERDailyTK) on X, posted approximately 3 hours before this analysis, August 10, 2026.
Hyperliquid Spot ETF Flow Data
HYPE spot ETF products have shown a mostly positive inflow trend over the past week.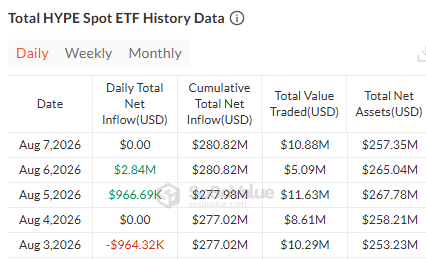
On August 6, daily net inflow came in at $2.84M, followed by a $0.00 day on August 7.
Earlier in the week, August 5 brought in $966.69K, while August 4 was flat at $0.00, and August 3 actually saw a net outflow of $964.32K.
Cumulative total net inflow has held steady around the $277M to $281M range across this window, with total net assets rising from $253.23M on August 3 to $257.35M by August 7.
This shows ETF demand has been choppy day to day but has not meaningfully reversed the broader inflow trend.
Source: SoSoValue, Total HYPE Spot ETF History Data, daily figures through August 7, 2026.
Hyperliquid Liquidation Snapshot
Liquidation activity has been relatively light over the shortest windows. 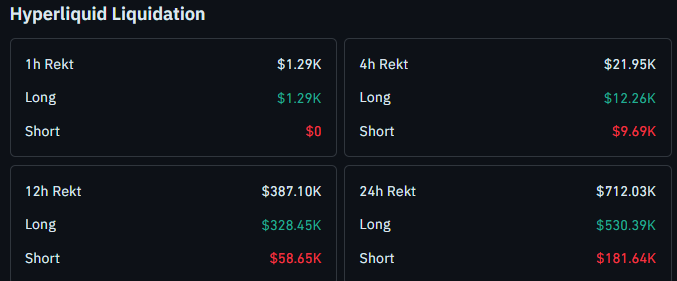
Over the past hour, only $1.29K in longs were liquidated with no short-side liquidations.
Over 4 hours, that grew to $21.95K total, split between $12.26K in longs and $9.69K in shorts.
The picture gets heavier over longer windows. Over 12 hours, $328.45K in longs were liquidated against $58.65K in shorts, for a total of $387.10K rekt.
Over 24 hours, long liquidations reached $530.39K against $181.64K in shorts, for a total of $712.03K rekt, showing longs have absorbed most of the pain over the past day.
Source: CoinGlass Hyperliquid Liquidation data page, captured August 10, 2026.
Hyperliquid 4-Hour Chart Analysis
HYPE spent late July sliding lower along a clear descending trendline, marked by three separate touches as price kept making lower highs on each retest.
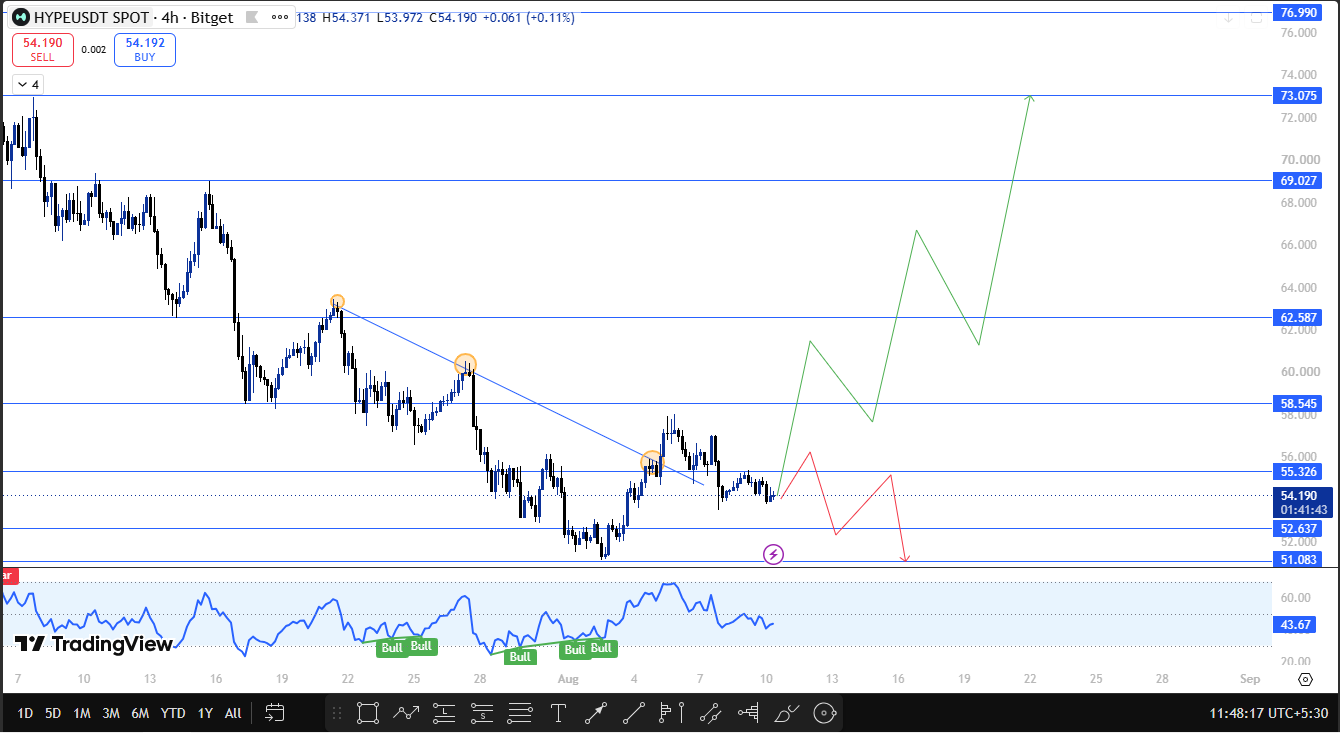
That trendline has technically been broken on the recent move up, which is usually an early bullish signal.
The 58.545 and 52.637 levels used throughout this piece are drawn directly from the chart's marked breakout and invalidation lines, not independently calculated.
The catch is that the price is still trading below the level that would actually confirm this breakout.
Until HYPE closes above 58.545, ideally supported by rising volume rather than a single low-volume wick, the move remains unconfirmed, and the broader range could still fail.
A confirmed close above that trigger would open a path toward 62.587 first, then 69.027 as the next major resistance zone.
If instead HYPE closes below 52.637, that would invalidate the trendline breakout entirely, and 51.083 would become the next support level to watch.
The chart's momentum oscillator has flashed multiple Bull signals at recent pullback lows through late July and early August, and currently reads 43.67, sitting in fairly neutral territory as price consolidates just under the breakout trigger.
The specific oscillator name and settings were not labeled on the supplied chart, so this reading should be treated as a general momentum gauge rather than a precisely calibrated signal.
Hyperliquid Long-Term Price Targets
Beyond the immediate 58.545 breakout trigger, the chart also maps out extended targets for a longer-running move if HYPE clears its nearer resistance levels.
Once 62.587 and 69.027 are taken out, 73.075 becomes the next longer term resistance to watch, with 76.990 marked as the furthest upside target on this chart.
These longer range levels depend entirely on HYPE first confirming the 58.545 breakout and then continuing through both 62.587 and 69.027, so they should be treated as directional reference points for a multi leg rally rather than a fixed timeline.
Hyperliquid Technical Outlook Snapshot
Indicator | Signal |
4-Hour Trendline | Broken descending trendline, breakout not yet confirmed |
Momentum Oscillator (RSI) | Reads 43.67, repeated Bull signals at recent pullback lows |
Structure Above CMP | Resistance cluster at 58.545, 62.587, 69.027, 73.075, 76.990 |
Structure Below CMP | Support cluster at 52.637, 51.083 |
HYPE Support and Resistance Levels to Watch
Type | Level | Note | % From CMP (calculated) |
Resistance | $76.990 | The furthest long-term upside target on this chart | +42.07% |
Resistance | $73.075 | Longer-term resistance beyond the near targets | +34.85% |
Resistance | $69.027 | Second target on confirmed breakout | +27.38% |
Resistance | $62.587 | First target on confirmed breakout | +15.49% |
Resistance | $58.545 | The trigger level needs a close above to confirm a breakout. | +8.04% |
Support | $52.637 | The trendline breakout fails on a close below this. | -2.87% |
Support | $51.083 | -5.73% |
Hyperliquid Risk-Reward Table
Case | Trigger | Target |
Bullish | Close above $58.545 | $62.587, $69.027, extended targets $73.075 and $76.990 |
Bearish | Close below $52.637 | $51.083 |
It is worth noting the general risks around trading these levels.
False breakouts are common when price stalls just below a confirmation trigger like this one, particularly on a close that is not backed by stronger than average volume, and leveraged positions near either level carry higher liquidation risk given the liquidation data already showing a clear long side skew over the past 24 hours.
What Would Change This HYPE Price Prediction?
This setup rests on two specific closes, above 58.545 or below 52.637. If HYPE instead keeps drifting sideways between those two levels without a decisive close on either side, the trendline breakout stays unconfirmed and this piece would need revisiting with fresh chart data.
A meaningful shift in ETF flow trends, or new developments in the JPMorgan versus Bitwise narrative, could also move sentiment independent of the technical picture.
How Bitcoin Sentiment Could Move HYPE
HYPE tends to react to broader market sentiment on top of its own catalysts. A strong Bitcoin move could speed up or delay HYPE's reaction at either the 58.545 or 52.637 level.
Update Trigger: When This Hyperliquid Price Prediction Gets Revisited
This piece will be revisited once HYPE delivers a confirmed close above 58.545 or below 52.637 on the 4-hour chart, once there is a meaningful shift in ETF inflow trends or fresh commentary in the JPMorgan versus Bitwise debate, or once a significant Bitcoin move materially shifts the setup described above.
All price, volume, open interest, and liquidation figures here should be treated as of the stated capture time and refreshed once either trigger level breaks.
Glossary
CMP: current market price, the live price at the time this data was captured
Rekt: trading shorthand for the total dollar value of leveraged positions forcibly liquidated
Open Interest: the total value of outstanding futures contracts not yet settled
Liquidation: the forced closing of a leveraged position when losses exceed the trader's margin
Trendline: a line drawn connecting a series of price highs or lows to show the direction of a trend
Net Inflow: the amount of new money moving into an ETF product on a given day, after accounting for redemptions
Momentum Oscillator: a technical indicator that measures the speed and strength of recent price moves to gauge trend strength
Bull, Base, and Bear Case
Bull Case
HYPE closes above $58.545 with supporting volume, confirming the trendline breakout and opening a path toward $62.587 and $69.027, with $73.075 and $76.990 as longer term extended targets if momentum builds.
Base Case
HYPE continues to trade between $52.637 and $58.545 without a decisive close on either side, keeping the breakout unconfirmed in the near term.
Bear Case
HYPE closes below $52.637, invalidating the trendline breakout, with $51.083 as the next level to watch.
Disclaimer
This article is for informational purposes only and should not be treated as financial advice. Cryptocurrency markets are highly volatile, and prices can move sharply in either direction. Please do your own research and consult a qualified financial advisor before making any investment decisions. CoinGabbar and the analyst do not hold a position in HYPE at the time of publication.
0
0

 Manage all your crypto, NFT and DeFi from one place
Securely connect the portfolio you’re using to start.

0
0

0
0

0
0

0
0