Polkadot Price Prediction: Rising Wedge Pattern Hints at Potential Downturn
21d ago•

bullish:
0
bearish:
0
Share

- Polkadot rebounds to $7.60 before sliding to $7.40, marking a short-term bullish trend.
- DOT trading volume surges by 62.41%, indicating heightened market activity.
- RSI at 53 signals neutrality; MACD shows weak but positive momentum.
Polkadot (DOT) has been in a bullish trend in the last 24 hours after establishing support at the intra-day low of $7.37. Subsequently, bullish momentum drove the price to a high of $7.60, where it met resistance and pulled back. However, during the rally, this price trend fluctuated between this intra-day high and a higher low of around $7.50, forming a short-term ascending channel.
However, as of press time, DOT’s bullish momentum has subsided as the price broke below this channel, exchanging hands at $7.40, a 0.70% surge from the support level. DOT’s bullish momentum was accompanied by increases of 0.05% and 29.96% in market capitalization and 24-hour trading volume, respectively, to $10,63 billion and $185.97 million.
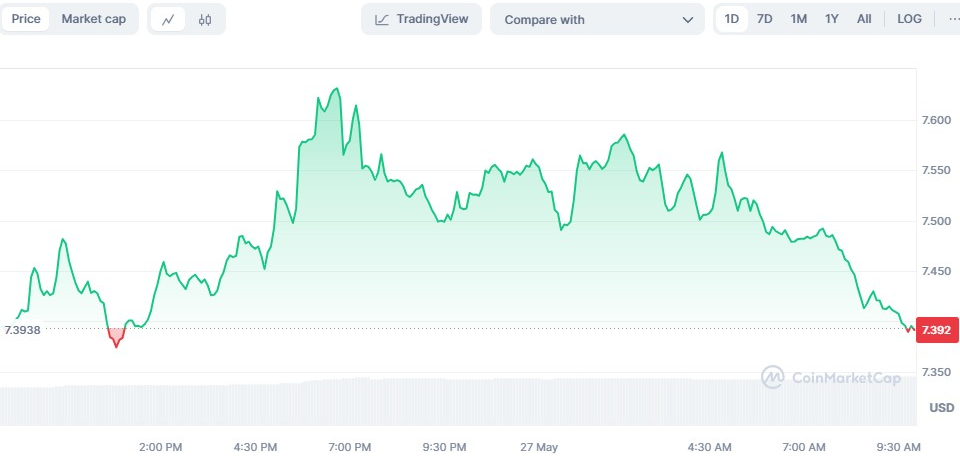
DOT/USD 24-hour price chart (source: CoinMarketCap)
In terms of DOT derivatives data, the bullish momentum propelled the trading volume up by 62.41%, reaching $226.70M. This surge suggests a substan…
The post Polkadot Price Prediction: Rising Wedge Pattern Hints at Potential Downturn appeared first on Coin Edition.
21d ago•
bullish:
0
bearish:
0
Share


 Manage all your crypto, NFT and DeFi from one place
Securely connect the portfolio you’re using to start.

bullish:
0
bearish:
0


bullish:
0
bearish:
0