
Aptos Price Prediction September 2026: Can $APT Reach $1?

0
0

Aptos Price Prediction: Is APT About to Break Its Losing Streak
A quiet shift is building in Aptos trading circles. Traders who had written APT off are paying attention again.
What Changed for Aptos Right Before September
A fresh wave of Aptos price prediction September 2026 is spreading, and it is not hard to see why. Something in APT's setup shifted fast enough that even skeptics are taking a second look, with new Aptos price prediction September 2026 discussions pulling fresh traders in.
So what actually happened, and does it hold up under real scrutiny?
Price Today: Live APT Market Data
As of 14:30 UTC on August 25, 2026, Aptos (APT) traded near $0.6131, down 0.84% over the previous 24 hours, according to CoinMarketCap market data.
The 24-hour range sat between $0.602 and $0.6279. Trading volume came in around $76.18 million, roughly 14.37% of market cap. Not a dead market. Not a euphoric one either.
Market cap held near $526 million, with a fully diluted valuation close to $1.28 billion against a 2.1 billion max supply. Circulating supply stood at 857.93 million APT.
And here's the interesting part: APT's all-time low of $0.516 was set just eight days earlier, on August 17, 2026. Since then, the token has climbed roughly 19.4%, a sharper move than the setup covered in the August APT price forecast. That's a real bounce, not noise.
Compare that to the all-time high of $19.90 from January 2023. The price still sits about 96.9% below that peak.
On-Chain Data and Aptos Fundamentals
Network activity tells a more encouraging story than the price chart alone. Daily user transactions on Aptos climbed from roughly 8 million on August 15 to over 12 million by August 21. Total staking across the network sits near 746.67 million APT spread across 85 validators, out of a total token supply of about 1.2 billion.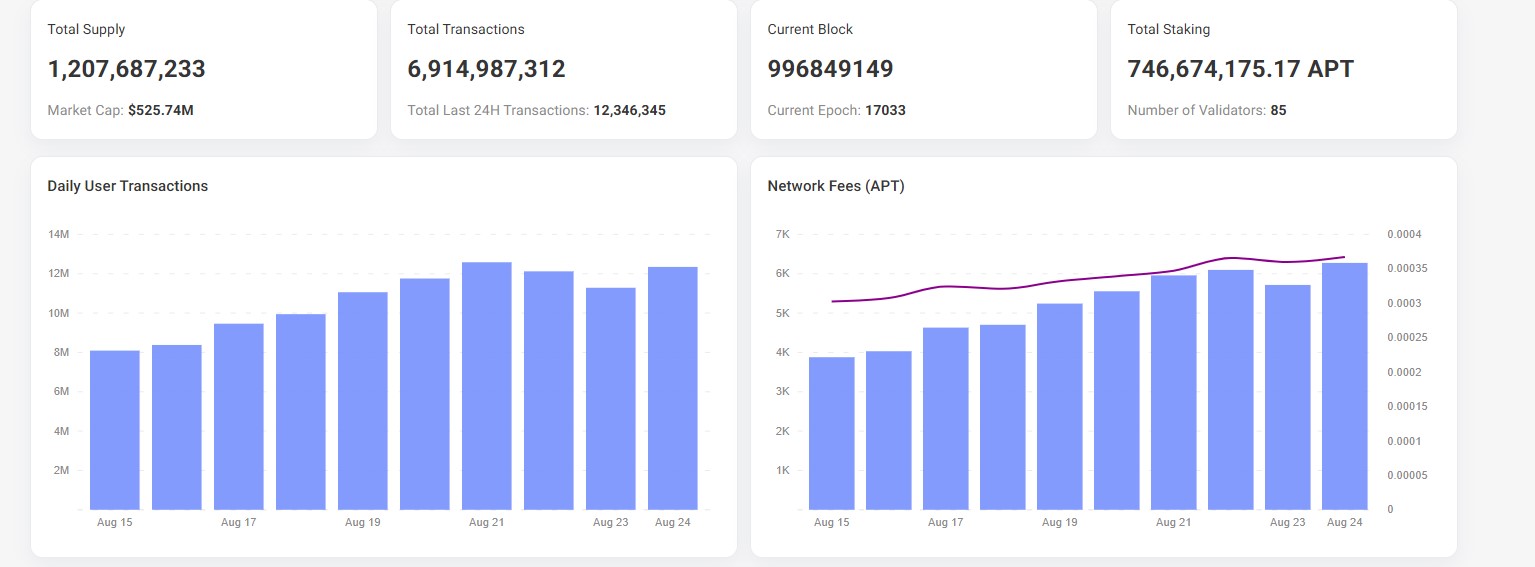
That means roughly 62% of circulating supply sits staked, a figure that reduces immediately sellable float. Network fees have also trended upward through the same window.
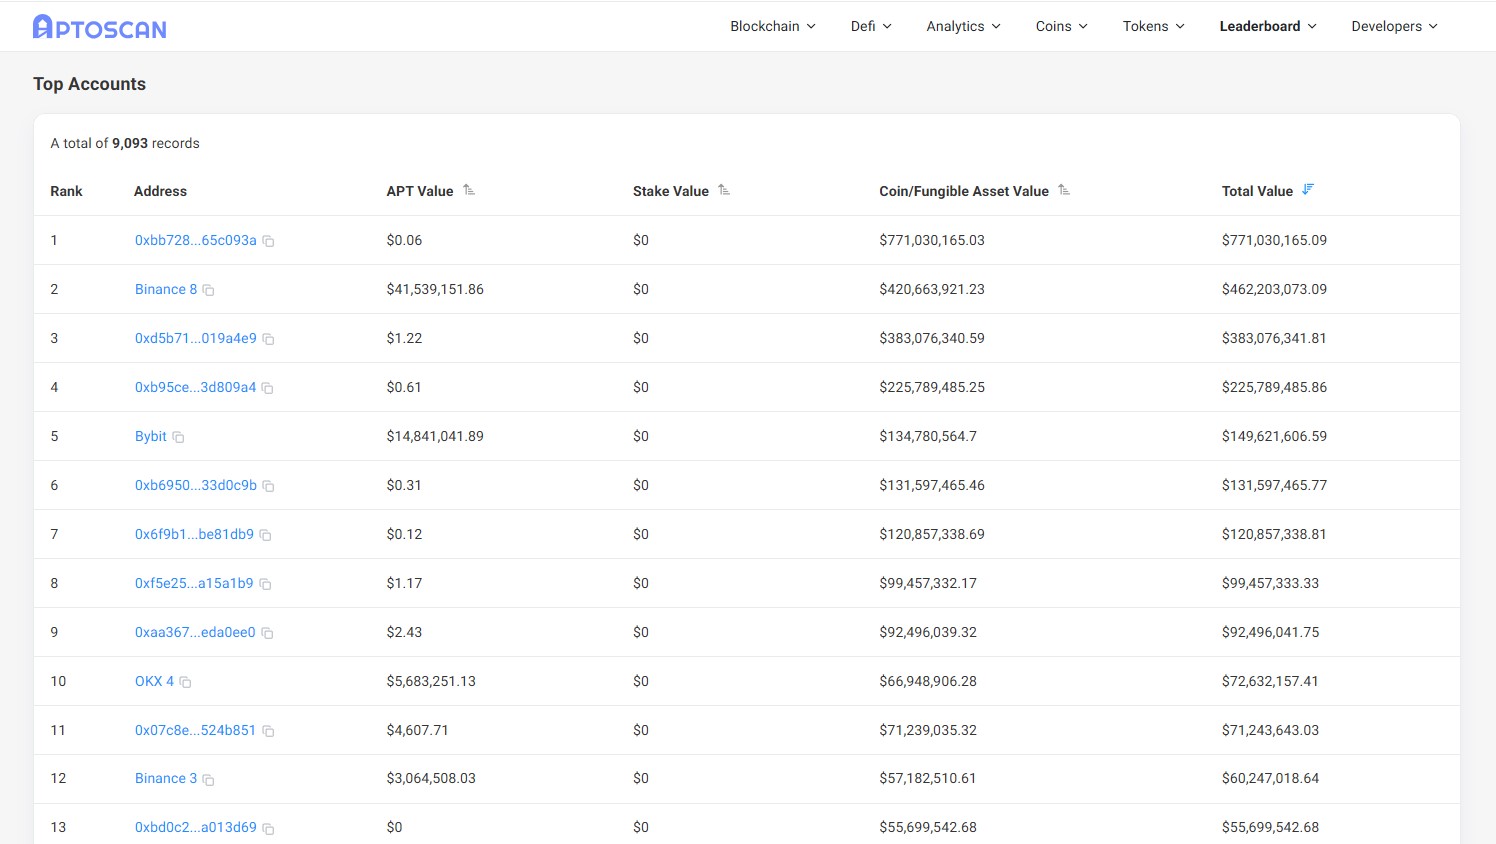
Whale concentration remains a real risk factor. The Aptoscan top accounts leaderboard shows the largest wallet holding a total value near $771 million, with Binance-linked addresses holding hundreds of millions more. Concentrated ownership can swing price fast when large holders move.
According to CoinGlass, liquidation data adds context to the recent bounce. Over the past 24 hours, long positions absorbed roughly $304,500 in liquidations versus just $8,530 in shorts, pointing to a market that had gotten too aggressively long before the pullback. Exchange volume stays heavily concentrated on Binance, which processed over $41 million of recent futures flow.
Technical Chart Analysis: Aptos Price Prediction September 2026
APT's chart structure looks different depending on which timeframe you check, and that gap between timeframes is exactly what makes this Aptos price prediction September 2026 setup worth breaking down piece by piece below.
4-Hour Chart Analysis: Short-Term Structure
APT's 4-hour trades show a recent descending channel breakout, with trading holding above the $0.6067 support cluster after weeks of grinding lower. RSI on the 4-hour sits near 50.35, a neutral reading with no exhaustion either way.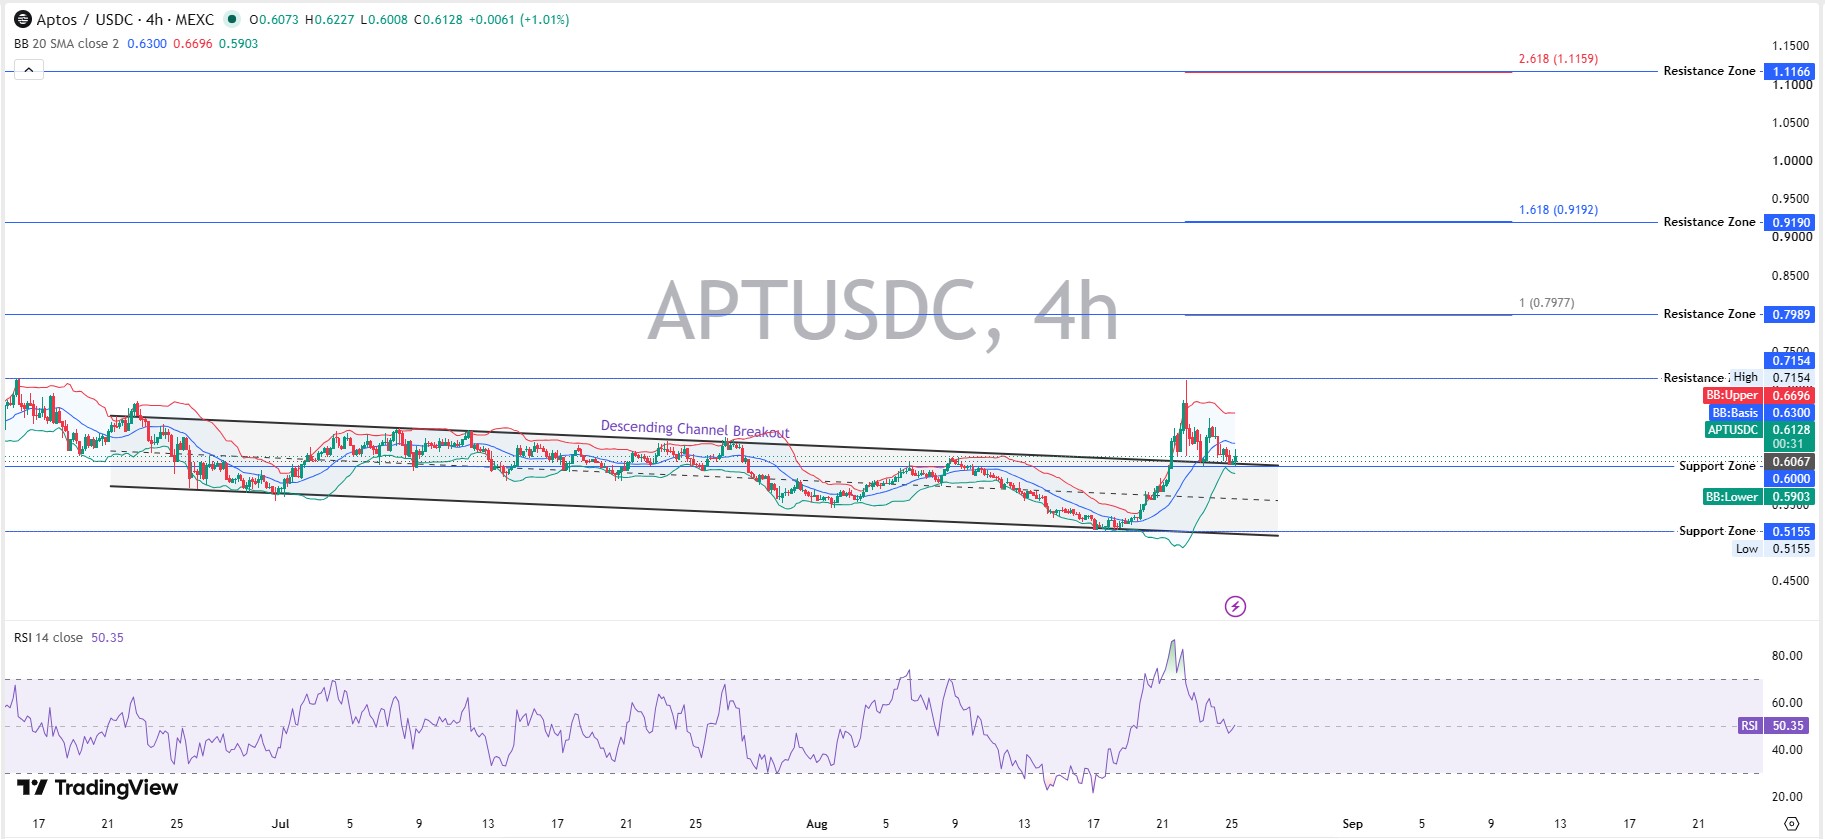
That neutral RSI matters. It means the recent bounce has not gotten overheated yet, leaving room to run before short-term traders start booking profit.
But one candle does not confirm a reversal. Watching whether trading holds above $0.6067 into the next few sessions will say more than this single breakout candle does.
Weekly Chart Analysis: The Falling Wedge
The weekly picture matters more here. A falling wedge has contained APT since December, and trading is now pressing against the wedge's upper boundary.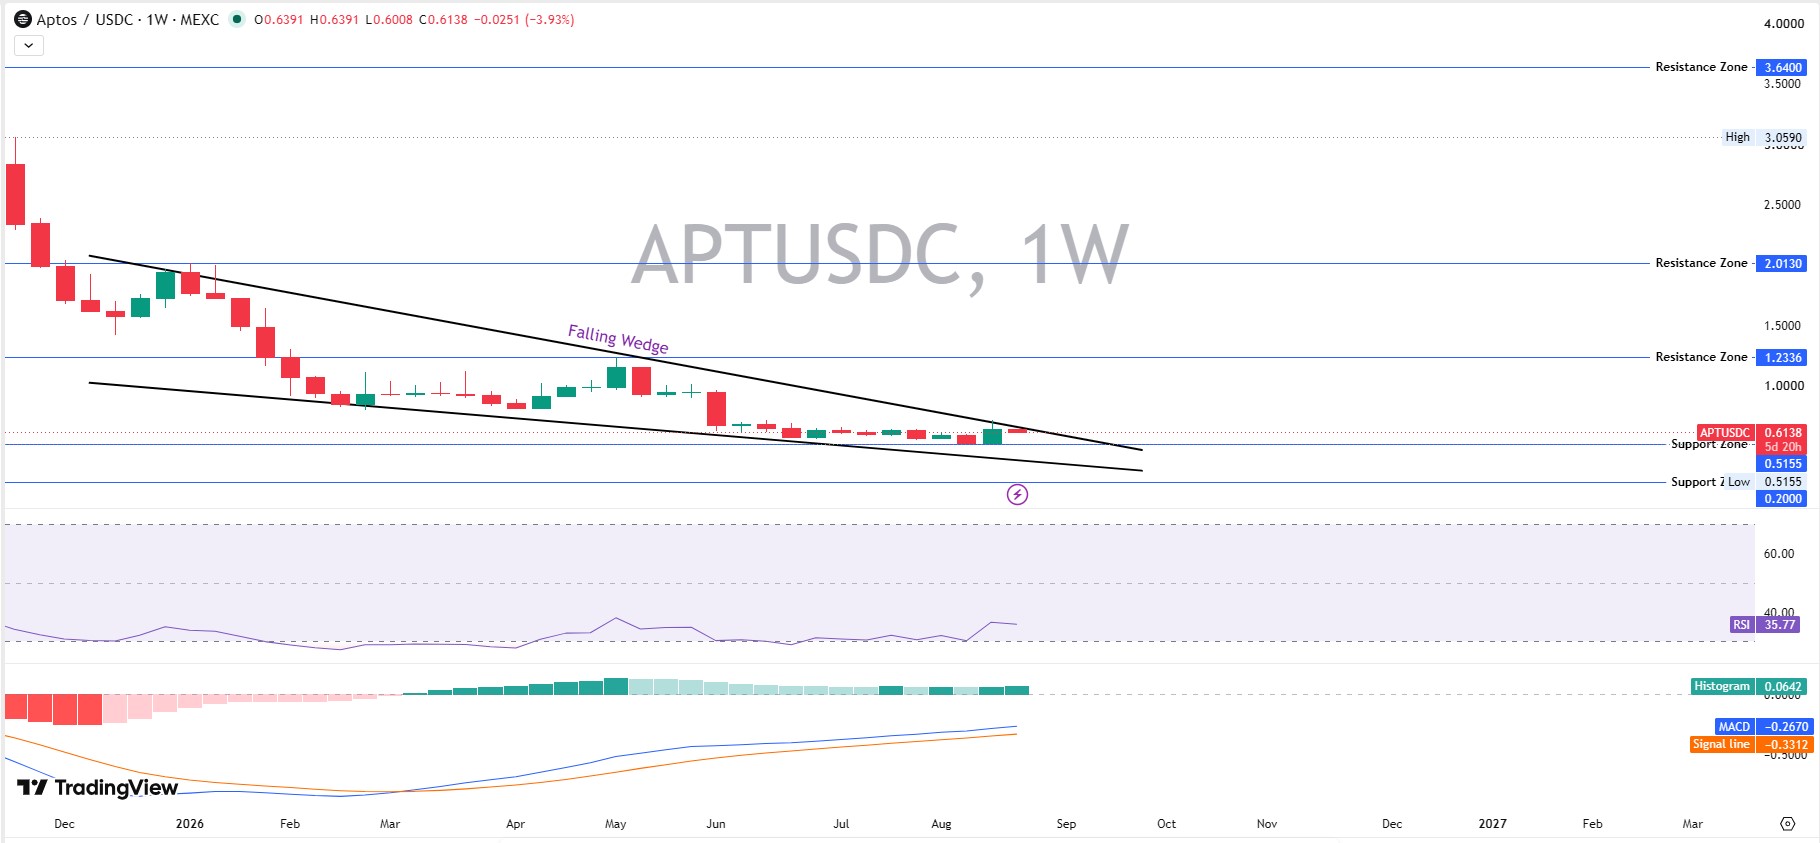
Weekly RSI reads 35.77, still soft, but the MACD histogram just turned positive at 0.0642, an early sign that bearish momentum is fading rather than accelerating.
And a wedge breakdown is just as possible as a breakout here. Falling wedges usually resolve upward, but "usually" is not a guarantee, and APT still needs a confirmed weekly trade above resistance to prove the pattern.
Monthly Chart Analysis: The Bigger Trend
The monthly chart is the reality check. APT remains inside a much larger descending channel that stretches back years, with the EMA9 sitting near $1.2551, far above current trading. That is a heavy overhead ceiling.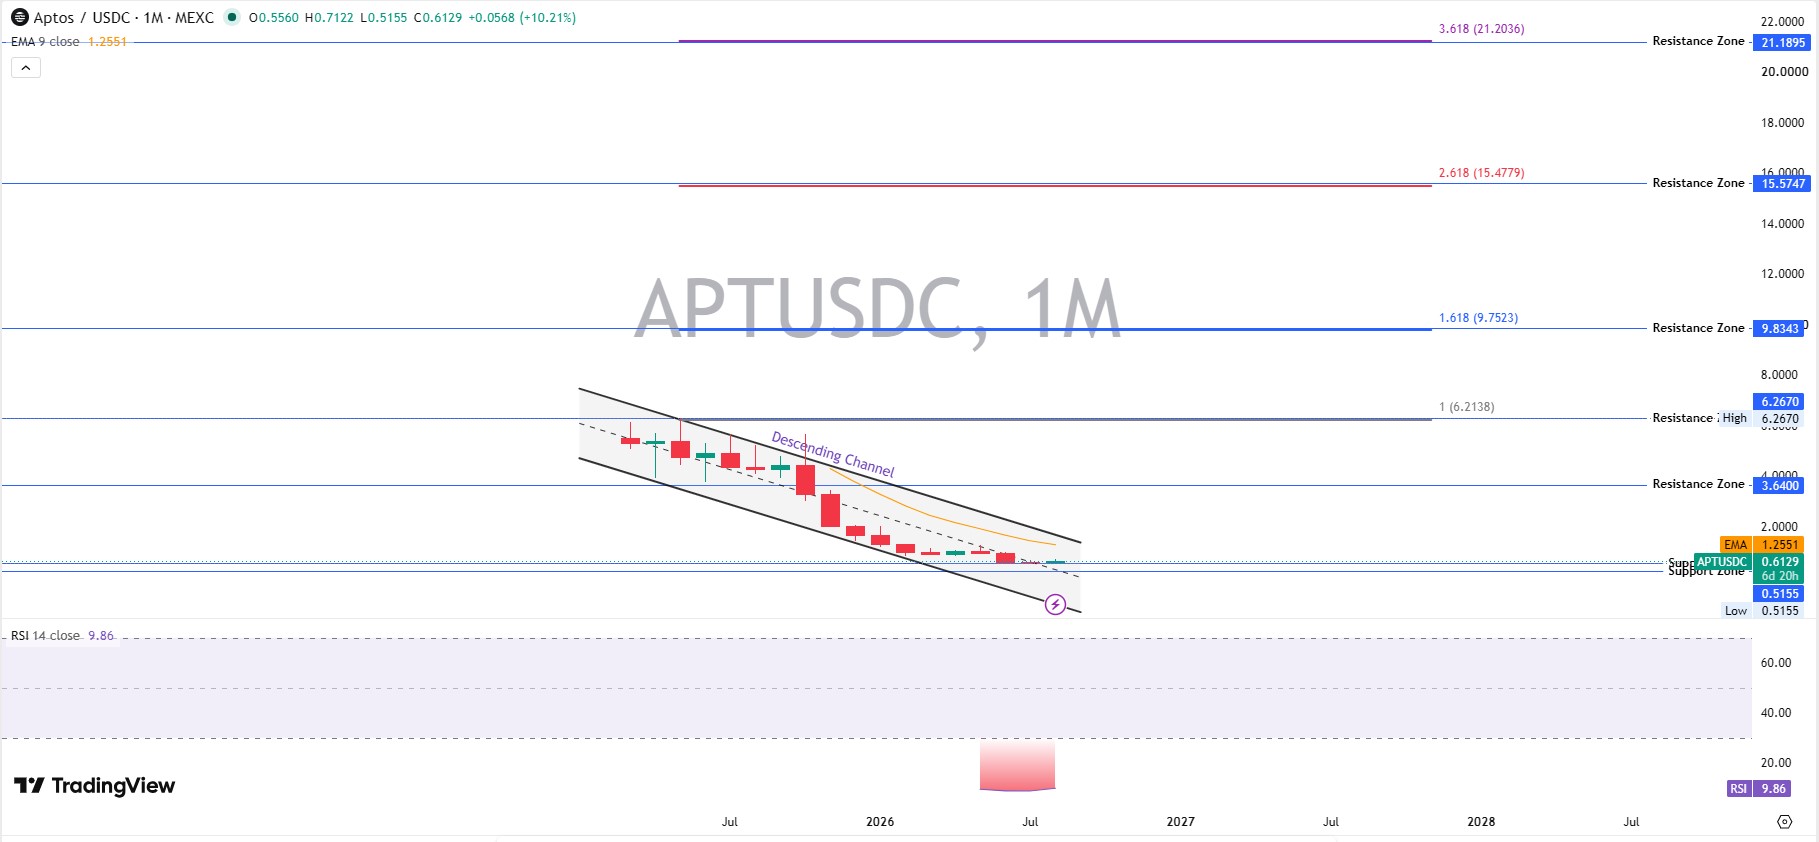
Turns out, short-term structure looks constructive while long-term structure still looks bearish. Both things are true at once, a tension also visible in the APT seller-pressure breakdown from a few weeks back.
Until the monthly channel breaks, treat any short-term strength as a bounce inside a bigger downtrend, not a full reversal.
September 2026 Prediction: Bull, Base and Bear Scenarios
This is where the Aptos price prediction September 2026 outlook actually gets built, not from one fixed number but from levels that either confirm or kill each case.
Bull case: A close and hold above the $0.6696 upper Bollinger band, backed by rising volume, opens the door toward $0.7154 and then the $0.7989 resistance zone. This mirrors the setup discussed in the earlier Aptos breakout attempt analysis, where confirmation needed the wedge to break upward with follow-through, not a single green candle.
Base case: APT keeps chopping between roughly $0.58 and $0.72, mirroring the falling wedge's shrinking range. RSI staying between 40 and 60 supports this grind. Nothing decisive happens until the wedge apex forces a break.
Bear case: Losing the $0.60 support zone reopens the path to $0.5155, the recent yearly low. A weekly trade below that level would undo the entire August bounce and put the descending channel back in control.
Timeframe | Bear Case | Base Case | Bull Case | Probability | Invalidation |
7 Days | Drop below $0.600 toward $0.5850 | Range $0.600–$0.650 | Break above $0.6696 toward $0.715 | Bear 30% / Base 45% / Bull 25% | 4h trade below $0.5900 |
30 Days | Lose $0.5155 support zone | Wedge range $0.55–$0.72 | Wedge breakout toward $0.80–$0.92 | Bear 35% / Base 40% / Bull 25% | Weekly close under $0.5155 |
Early 2027 | Extended slide toward $0.35–$0.45 | Recovery range $0.60–$1.20 | Reclaim $1.2336, push toward $2.00 | Bear 25% / Base 45% / Bull 30% | Loss of the ATL zone on rising volume |
APT Price Prediction Summary Table: 2026 to 2030
This Aptos price prediction September 2026 outlook does not stop at year-end. Here is how the Minimum, Average, and Maximum figures were built out year by year, with the math shown rather than numbers pulled from thin air.
Year | Minimum | Average | Maximum |
2026 | $0.45 | $0.62 | $0.92 |
2027 | $0.32 | $0.75 | $1.35 |
2028 | $0.30 | $0.95 | $2.10 |
2029 | $0.28 | $1.25 | $3.75 |
2030 | $0.25 | $1.65 | $6.35 |
How the minimum was calculated: The recent swing high near $0.7154 to the August low of $0.5155 marks a measured range of $0.1999. Projecting that same range below the low gives $0.5155 − $0.1999 ≈ $0.3156, the floor used for 2027 onward.
For 2026 specifically, the minimum sits higher, near $0.45, since only a partial breakdown of the current wedge fits inside the remaining months of the year. Deeper multi-year bear cases (2029 to 2030) lean on the $0.20 support zone already visible on the weekly chart.
How the maximum was calculated: Each year's ceiling maps to a Fibonacci extension zone already plotted on the charts. $0.7989 (the 1.000 extension) and $0.9190 (the 1.618 extension) anchor 2026. $1.2336, a confirmed weekly resistance zone, anchors 2027 to 2028 alongside the $2.0130 zone.
$3.6400 and $6.2670 (1.000 monthly extension) anchor 2029 and 2030, respectively, assuming a full multi-year recovery cycle plays out.
Invalidation for this table: A weekly trade below $0.5155 pushes actual price action toward the minimum column early, ahead of schedule. A confirmed weekly close above $1.2336 would pull the Maximum column forward instead, meaning the 2028 target could arrive as soon as 2027.
Can APT Reach $1?
Using a target price of $1.00 against the current circulating supply of 857.93 million APT:
$1.00 × 857.93M = $857.93 million required market cap
Against a total supply of 1.2 billion once fully circulating:
$1.00 × 1.2B ≈ $1.2 billion required market cap
Compare that to the current market cap of roughly $526 million. Reaching $857.93 million represents about a 1.63x move in price from the current $0.6131, since $1.00 ÷ $0.6131 ≈ 1.63.
That is a far smaller stretch than it sounds, especially next to Aptos's own trading history: APT has already traded above $1 for extended periods and reached an all-time high of $19.90 in January 2023, so reclaiming $1 does not require a brand-new valuation regime the way it would for an unproven token.
It mainly requires unwinding part of a multi-year downtrend, with the $1.2336 weekly resistance zone standing as the technical marker that would confirm the move is real rather than a short squeeze.
Ecosystem Catalysts That Could Move APT in September
News flow, not just charts, will decide where this Aptos price forecast lands. The clearest recent catalyst: spot trading went live on Decibel, an onchain trading venue built on Aptos, letting users trade or hold spot alongside perpetuals and use eligible spot positions as collateral in one onchain venue, according to a recent official Aptos update.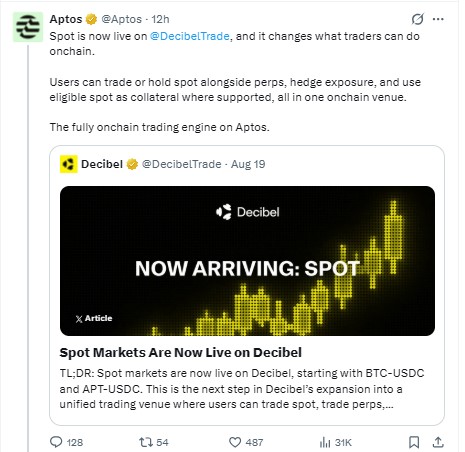
That's a real infrastructure expansion, not vague hype. More onchain trading volume routed through Aptos could support fee growth and staking demand into September.
Beyond that, broader crypto direction still dominates. Bitcoin's trend and shifting expectations around the Fed rate decision timeline will likely pull altcoins, including APT, along with them regardless of Aptos-specific news.
Regulatory clarity matters too. Progress or setbacks tied to the Clarity Act negotiations could shift sentiment across every Layer-1 token, Aptos included.
Upcoming Catalysts Calendar
Macro events tend to move APT just as much as anything Aptos-specific does, so pairing ecosystem news against the broader economic calendar gives a clearer read on what could actually move price into September.
Event | Expected Date | Potential Impact |
Decibel spot trading rollout, continued volume growth | Ongoing, since Aug 19, 2026 | Medium, supports fee growth and staking demand if adoption holds |
US CPI report for August 2026 | Sep 11, 2026 | Medium-high shapes rate-cut odds heading into the FOMC decision |
FOMC meeting + Summary of Economic Projections | Sep 15–16, 2026 | High, primary macro catalyst for all of crypto, APT included |
Aptos ecosystem and DeFi TVL updates | Ongoing, H2 2026 | Medium, confirms or undercuts the on-chain growth thesis above |
Token unlock and supply circulation events | Unconfirmed date | Medium-high dilution risk if not offset by fresh demand |
Aptos as a Layer-1 Altcoin: Where APT Stands in the Race
Aptos competes directly against other high-throughput Layer-1 altcoins chasing the same developer and liquidity pool, a theme visible across broader price prediction coverage. Its move-language architecture and growing DeFi footprint give it a technical edge, but adoption still trails larger ecosystems.
For an APT price target 2026 to hold up, Aptos needs sustained transaction growth, not just a single announcement spike. The Decibel integration helps, but altcoin rotation cycles tend to reward ecosystems with the deepest liquidity first.
And that's the honest tension here: strong fundamentals on a token still fighting a multi-year downtrend, one that keeps drawing comparisons to Bitcoin's own market cycles.
What Analysts Are Forecasting
Independent trading desks and community analysts covering Aptos chart setups on TradingView have flagged the same falling wedge structure highlighted above, generally treating a breakout above the $0.70–$0.72 zone as the trigger for renewed bullish attention.
These are technical projections built on pattern assumptions, not guarantees. Fundamentals and macro conditions can override any chart pattern within days.
Long-Term Outlook: 2027 to 2030
Beyond September, Aptos's trajectory depends on whether onchain activity keeps compounding. Rising staking participation and transaction counts support a longer recovery case if broader market conditions cooperate.
A sustained reclaim of the $1.2336 zone would mark the first real technical signal that the multi-year downtrend is ending. Until then, treat any 2027-2030 figures as wide ranges, not fixed targets, and keep an eye on the upcoming Aptos event calendar for scheduled catalysts.
Risks That Could Invalidate This Forecast
Bitcoin weakness remains the biggest swing factor for any altcoin, APT included. A broader risk-off shift tied to regulatory noise, including ongoing MiCA regulation enforcement across European platforms, could pressure altcoin liquidity generally.
Whale concentration adds another layer of risk given how much value sits in a small number of wallets. And unlock-related supply pressure, combined with thin order books outside the top three exchanges can amplify moves in either direction.
Those are the honest caveats behind every scenario in this piece.
Disclaimer
This article is for informational purposes only and does not constitute financial, investment, or trading advice. Cryptocurrency markets, including Aptos (APT), are highly volatile and carry real risk of loss. Prices, support and resistance levels, and scenario probabilities discussed here are based on data available at the time of writing and can change quickly. Always conduct independent research and consult a licensed financial advisor before making investment decisions.
0
0

 Manage all your crypto, NFT and DeFi from one place
Securely connect the portfolio you’re using to start.


