
Synapse Price Prediction 2026: Can $SYN Continue Its Bullish Breakout?

0
0

After weeks of consolidation, Synapse ($SYN) has finally broken above its descending trendline, putting Synapse price prediction back in focus among crypto traders. The breakout, supported by improving momentum and higher trading volume, has shifted market sentiment from cautious to optimistic.
While the short-term technical outlook has improved, investors are now watching closely to see whether $SYN can sustain this rally and break through key resistance levels or face another rejection. This Synapse Price Prediction explores the token's technical analysis, key support and resistance zones, and potential price targets for 2026 and beyond.
Synapse Price Prediction Key Takeaways
-
$SYN has broken above a short-term descending channel, signaling renewed bullish momentum.
-
The token rallied from around $0.08 to above $0.12 in a strong breakout move.
-
24-hour trading volume reached approximately $58.37 million, nearly 198% of market capitalization, indicating exceptionally high market participation.
-
1-hour RSI is around 66, showing strong momentum while remaining below deeply overbought territory.
-
Weekly RSI sits near 49.7, suggesting the longer-term trend is improving but has not yet confirmed a full bullish reversal.
-
Immediate resistance stands at $0.1320-$0.1362, followed by $0.1512.
-
Key support levels are $0.1060, $0.0983-$0.0942, and $0.0813.
-
SYN remains roughly 97.6% below its all-time high of $5.01, leaving significant upside if the broader trend continues improving.
-
Around 94% of the maximum supply is already circulating, reducing concerns over major future token dilution.
-
On-chain data shows high whale concentration, meaning large holders could continue contributing to elevated price volatility.
| Attribute | Details |
|---|---|
| Token Name | Synapse |
| Ticker | SYN |
| Category | Cross-Chain Interoperability / DeFi Infrastructure |
| Blockchain | Ethereum (Multi-chain Protocol) |
| Current Price | $0.1277 |
| Market Capitalization | $28.56 Million |
| Fully Diluted Valuation (FDV) | $30.45 Million |
| 24H Trading Volume | $58.37 Million |
| Volume/Market Cap Ratio | 198.1% |
| Circulating Supply | 234.48 Million SYN |
| All-Time High (ATH) | $5.01 (October 24, 2021) |
| All-Time Low (ATL) | $0.02736 |
| Primary Use Case | Cross-chain asset transfers and blockchain interoperability |
| Key Ecosystem Product | Hypercall (Decentralized Options Platform) |
| Market Outlook | Short-term bullish breakout; long-term recovery still developing |
Synapse (SYN) is gaining momentum after breaking above a short-term descending channel, signaling a bullish technical reversal. The breakout pushed the token above the key $0.0942 resistance level, attracting fresh buying interest and improving market sentiment.
Trading activity has also surged, with 24-hour volume reaching approximately $58.37 million, resulting in a volume-to-market cap ratio of nearly 198%. This strong participation suggests the rally is supported by genuine demand rather than low-liquidity trading.
Unlike many recent altcoin pumps, Synapse has seen relatively balanced liquidation activity, with only about $99,000 liquidated over the past 24 hours. This indicates the price increase is driven primarily by spot buying instead of a large short squeeze.
Fundamentally, the project continues expanding its ecosystem through Hypercall, its decentralized options platform offering fractional crypto options. With 94% of its maximum token supply already circulating and strong liquidity across major exchanges like Binance, LBank, MEXC, and Bitget, Synapse currently benefits from both technical strength and improving fundamentals.
Synapse Technical Analysis: Daily Chart
The hourly SYN/USDT chart reflects a strong bullish reversal after the token broke out of a short-term descending channel that had capped price action for several trading sessions. $SYN trades near $0.1277, confirming renewed buying momentum and attracting significant trading activity.
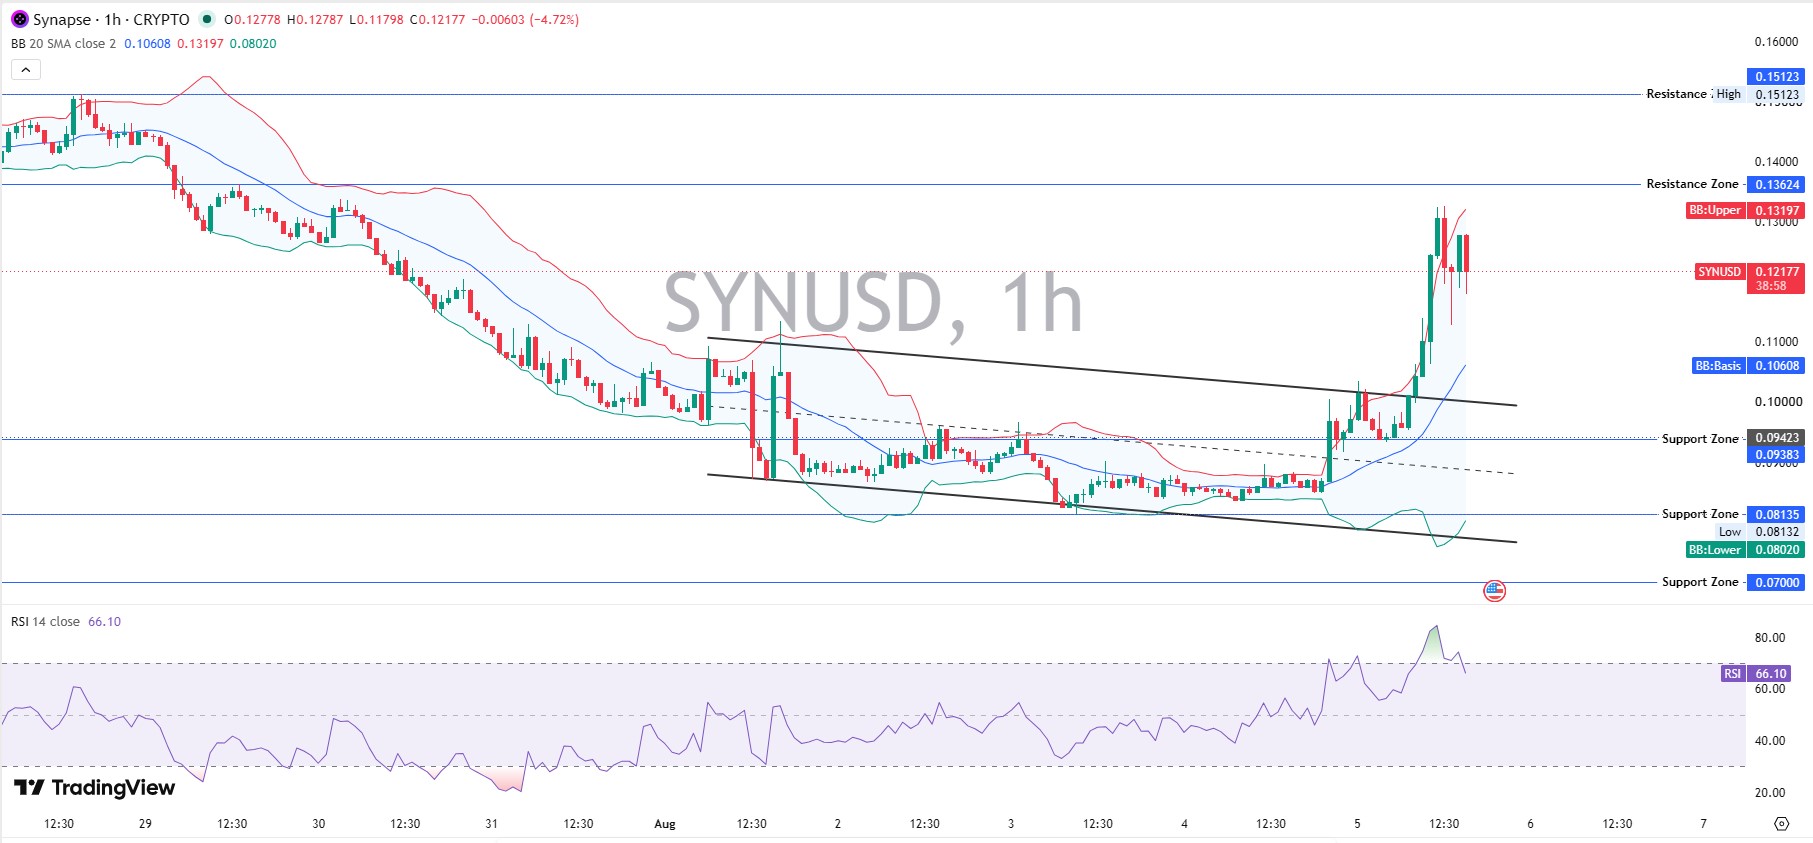
The breakout carried the price above the important $0.0942 resistance zone, which has now turned into a key support area. Price is currently trading above the Bollinger Band basis near $0.1061, while the upper Bollinger Band sits around $0.1320. Holding above the middle band suggests buyers remain in control, although the price is approaching an area where short-term profit-taking could emerge.
The RSI is hovering around 66, indicating strong bullish momentum without entering deeply overbought territory.
The immediate resistance zone is located between $0.1320 and $0.1362. A decisive breakout above this range would strengthen the bullish outlook and could send SYN toward the next major resistance at $0.1512.
On the downside, the first support sits at $0.1060, followed by the critical $0.0983-$0.0942 demand zone. Losing these levels would weaken the breakout structure and increase the probability of a deeper retracement toward $0.0813.
Synapse Technical Analysis: Weekly Chart
The weekly chart shows that Synapse (SYN) is still recovering from a prolonged bearish trend. Price remains within a long-term falling wedge, a pattern that often signals a potential trend reversal if buyers can maintain momentum.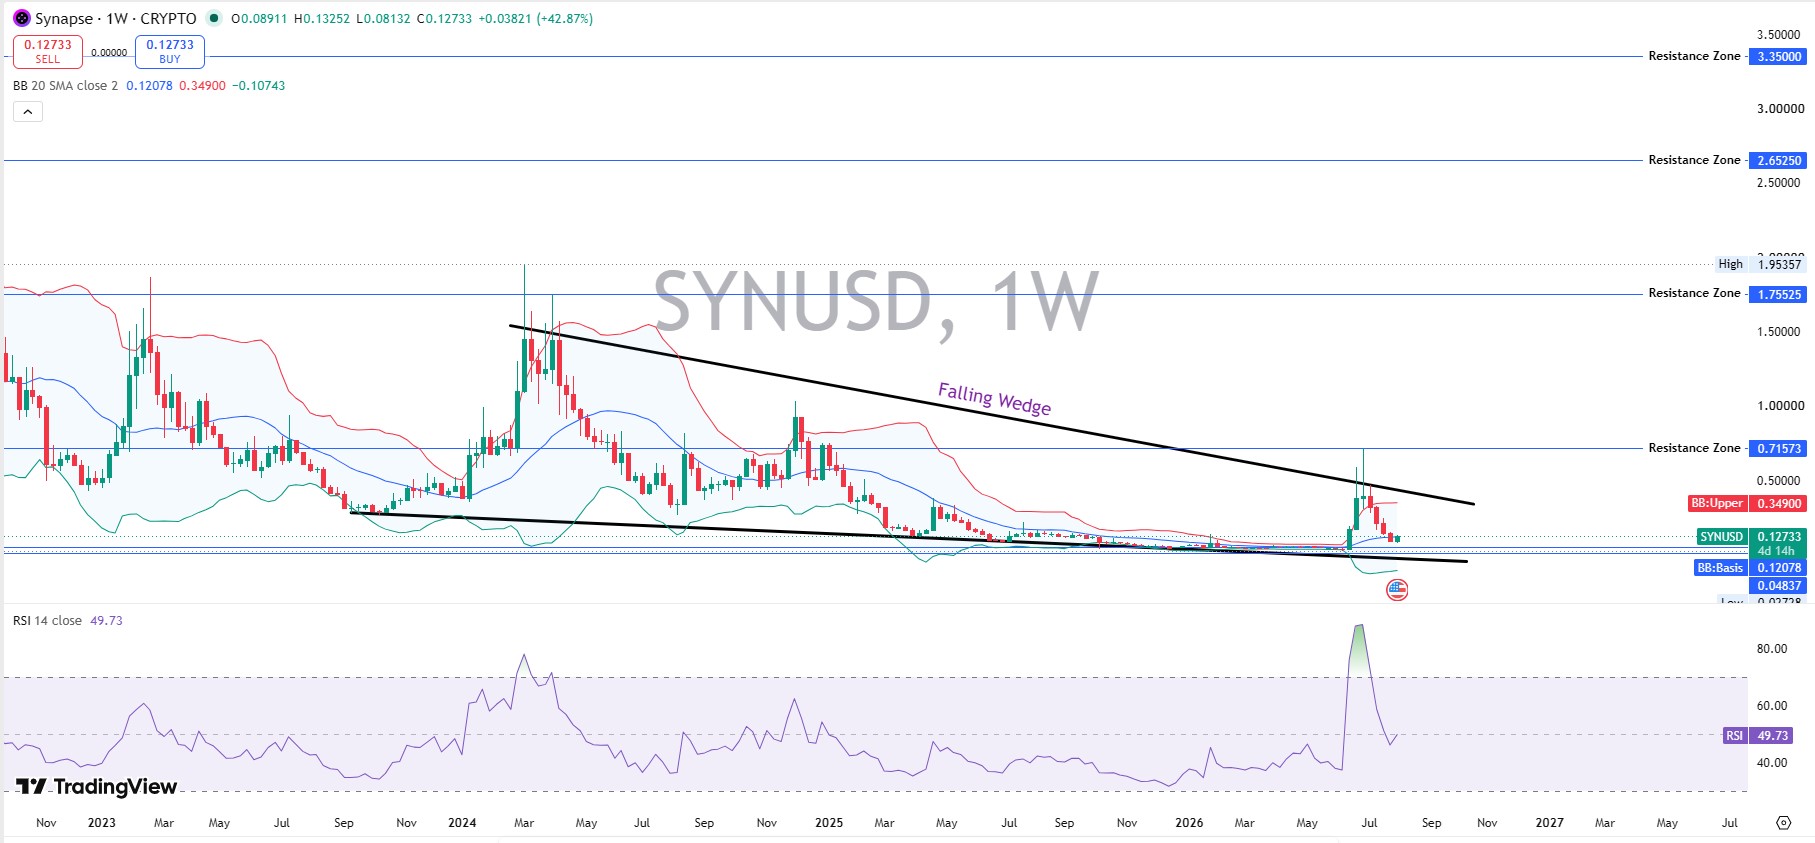
A key development is SYN's attempt to establish support around $0.12, which closely matches the weekly Bollinger Band basis at $0.1208. Holding this level would improve the chances of a sustained medium-term recovery.
The weekly RSI is around 49.7, indicating momentum has recovered from oversold conditions but has not yet confirmed a fully bullish trend. Buyers still need stronger follow-through to validate a long-term reversal.
On the upside, major resistance levels are $0.3490, $0.7157, and $1.7553. Meanwhile, the $0.0813-$0.0940 zone remains the key long-term support area. A sustained break above $0.1362-$0.1512 would strengthen the bullish outlook and increase the probability of a larger recovery.
Synapse Tokenomics and Supply Risk
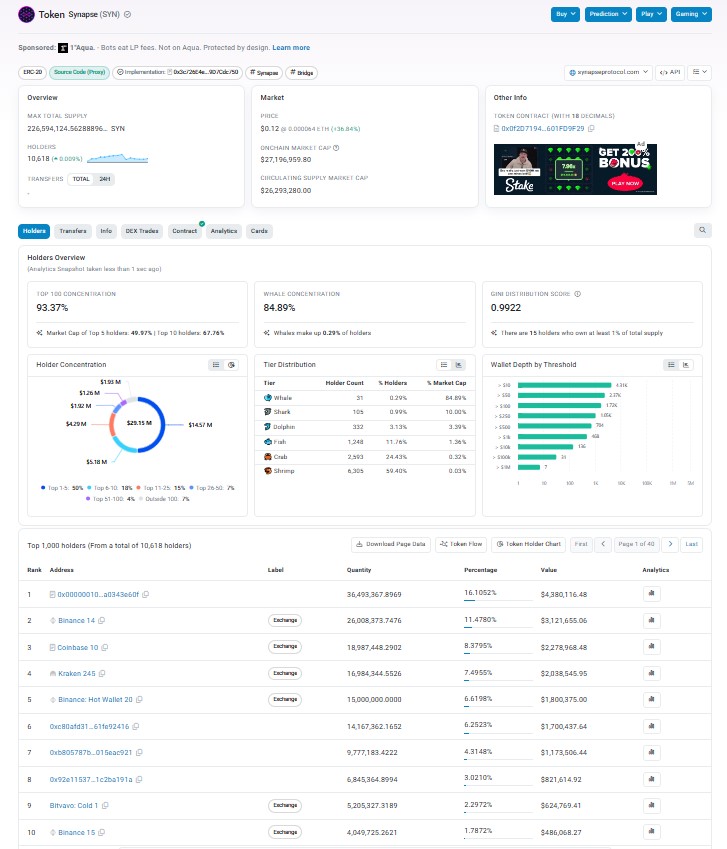
As per Etherscan , Synapse has a maximum supply of 250 million SYN, with approximately 234.48 million tokens already in circulation. Since most of the supply has already entered the market, investors face relatively limited inflation risk compared with projects that have large future unlock schedules.
Current Supply Statistics
-
Maximum Supply: 250 million SYN
-
Total Supply: 248.5 million SYN
-
Circulating Supply: 234.48 million SYN (about 94%)
-
Holders: More than 277,000 wallet addresses across supported networks
Unlike many recently launched altcoins, Synapse does not face major near-term token unlock events that could significantly increase selling pressure. Instead, the primary supply-related risk comes from the high concentration of tokens among whale wallets and centralized exchanges, making large transfers worth monitoring.
Synapse Price Prediction: Bull, Base and Bear Cases
| Scenario | Target Range | Timeframe | Probability | Key Condition | Invalidation |
| Bull Case | $0.136 - $0.151 | 30 Days | Moderate | Breaks above $0.1362 with strong volume | Daily close below $0.106 |
| Base Case | $0.106 - $0.136 | 30 Days | Higher | Holds above $0.106 and consolidates | Weekly close below $0.094 |
| Bear Case | $0.081 - $0.094 | 30 Days | Lower | Loses $0.106 support and selling accelerates | Breakout structure fails |
These scenarios represent possible outcomes based on current technical conditions and should not be interpreted as guaranteed price targets.
24-Hour and 7-Day Outlook
| Timeframe | Bullish Scenario | Base Scenario | Bearish Scenario |
| 24 Hours | Break above $0.1362 | Consolidate between $0.120 and $0.132. | Fall below $0.106 |
| 7 Days | Rally toward $0.1512 | Continue ranging above $0.12 | Retest $0.0942 support |
In the short term, momentum remains favorable for buyers. However, with the 1-hour RSI near 66, a period of consolidation or mild profit-taking would be healthy before another sustained advance.
What Could Push SYN Lower?
Several factors could weaken Synapse's bullish outlook:
-
A daily close below the $0.106 support level.
-
Loss of the critical $0.0942-$0.0983 support zone.
-
Heavy selling by whale wallets, given the highly concentrated token ownership.
-
A broad cryptocurrency market correction driven by macroeconomic events or risk-off sentiment.
-
Declining trading volume following the recent breakout.
-
Slower-than-expected adoption of Synapse's cross-chain infrastructure and ecosystem products.
Disclaimer: This article is for informational purposes only and isn't financial advice. Crypto markets are volatile; do your own research before making any investment decision. Data captured August 5, 2026, from CoinMarketCap, CoinGlass, and project-published sources.
0
0


 Управляйте всей своей криптовалютой, NFT и DeFi из одного места
Безопасно подключите используемый вами портфель для начала.