
Cosmos Price Prediction: $ATOM Global Update? $2.5 Key Target

0
0

$ATOM is waking up. One trader flagged the breakout as the start of something bigger, calling it a setup worth tracking closely as buyers take control.
Price is up nearly 13% on the day, and Cosmos's ongoing push to connect independent blockchains is adding fresh attention to the token.
This Cosmos price prediction looks at whether ATOM's breakout has the momentum to keep running or if it needs to cool off first.
Here's what the chart shows.
Market data was checked on September 9, 2026, at 04:04 UTC-3.
Cosmos Price Prediction Today: Market Overview
| Metric | Value |
| Price | $1.850 |
| 24h Change | +13% |
| Market Cap | $977.43M |
| FDV | $973.27M |
| 24h Volume | $78.18M |
| Vol/Mkt Cap (24h) | 8.03% |
| Total Supply | 529.46M |
| Max Supply | Uncapped |
| Circulating Supply | 529.46M |
Source: Data from CoinMarketCap as of September 9, 2026, at 04:04 UTC-3. Figures may vary slightly across other tracking websites.
$ATOM News Today: Global Update
Cosmos's ongoing development of its interchain infrastructure, which lets independent blockchain networks communicate and exchange data directly. 
Source: Data From X
The broader vision described was one where no single blockchain controls everything, and instead many specialized chains stay connected through shared infrastructure, a narrative that continues to support long-term interest in $ATOM price prediction discussions.
Cosmos Crypto News Today
A post on X from a trader tracking ATOM closely described the token pushing through a key level with bullish strength, putting it firmly on the radar. 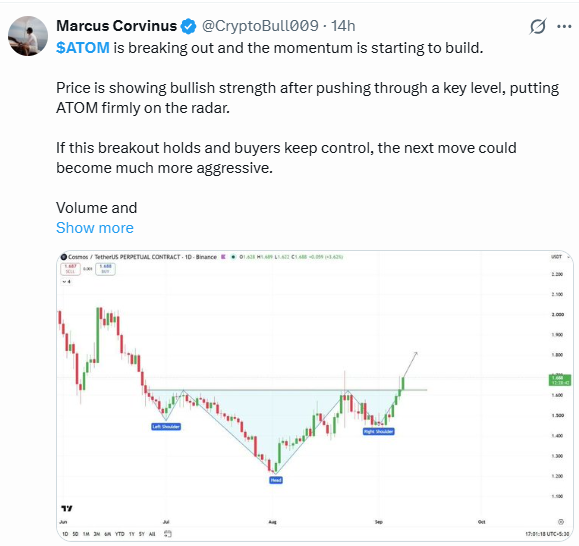
The post noted that if the breakout holds and buyers stay in control, the next move could get more aggressive, with volume and follow-through as the deciding factors, a setup now central to the current Cosmos price prediction 2026.
Cosmos Liquidations and Futures Volume
The breakout has triggered a clear short squeeze.
Over the past 24 hours, total liquidations hit $479.72K, with $440.81K of that coming from short positions against just $38.92K in longs.
The 12h window shows the same pattern ($179.77K total, $153.06K of it shorts), suggesting short sellers have repeatedly been caught out as ATOM pushed higher.
Source: Data From CoinGlass
On futures volume, Binance leads with $59.43M, followed by LBank ($33.07M), Bybit ($17.60M), MEXC ($12.83M), OKX ($11.17M), WhiteBIT ($10.36M), Bitunix ($4.48M), BingX ($4.78M), and Bitget ($3.36M).
$ATOM Price Prediction Technical Analysis
Pair: ATOM/USDT · Market: Spot (Crypto) · Exchange: OKX · Timeframe: 1D · Source: TradingView · Timestamp: September 9, 2026, 04:04 UTC-3
$ATOM is trading at $1.850, up 13% on the daily candle after a sharp breakout out of a rounded cup-and-handle base that formed through July and August.
Price cleared both EMAs and the $1.801 resistance zone in a fast vertical move.
RSI has pushed to 75.73, into overbought territory, even as its underlying average near 56.66 stays constructive, a sign the move has been fast, not always unhealthy.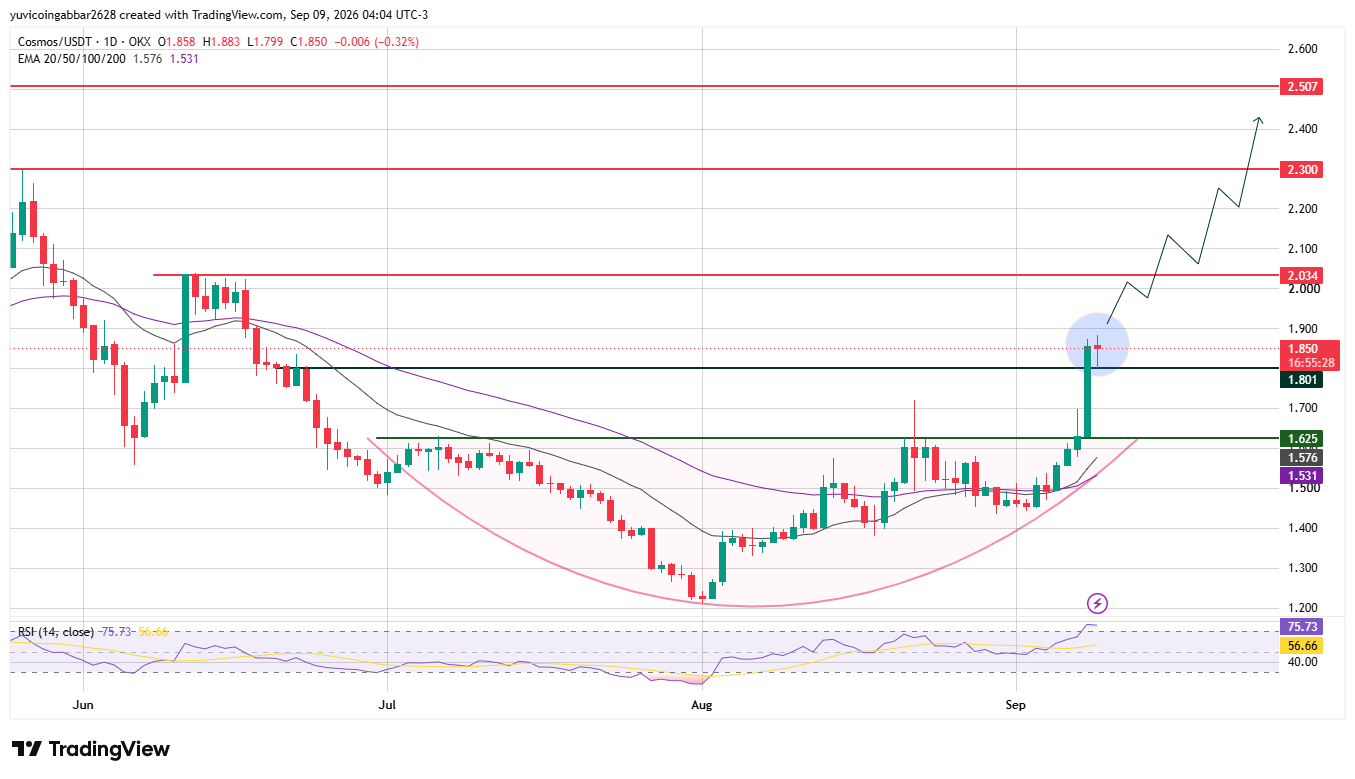
Support and Resistance Levels
| Level Type | Price |
| Resistance 3 | $2.507 |
| Resistance 2 | $2.300 |
| Resistance 1 (nearest) | $2.034 |
| Immediate Price Reference | $1.850 |
| First Confirmed Support (breakout zone) | $1.801 |
| Deeper Support | $1.625 |
EMA Levels
| EMA | Price |
| EMA20 | $1.576 |
| EMA50 | $1.531 |
Cosmos Price Forecast: Bull Case vs Bear Case
Bull case: Holding above the breakout zone at $1.801, well clear of the EMA cluster near $1.531 to $1.576, keeps the bullish structure intact.
A confirmed move above $2.034 would open the path toward $2.300 and eventually $2.507.
Bear case: With RSI at 75.73, a short-term pullback risk is elevated.
A close back below $1.801 would put the breakout in doubt, and losing $1.625 would put the EMA cluster near $1.531 to $1.576 back in play as support.
ATOM Price Prediction: Triggers and Invalidation Levels
| Scenario | Trigger | Likely Outcome | Invalidation Point |
| Bullish continuation | Hold above $1.801, break $2.034 | Move toward $2.300 and $2.507 | Close below $1.801 |
| Range consolidation | Rejection at $2.034, hold above $1.801 | Sideways chop near current levels | Break below $1.801 |
| Bearish breakdown | Lose $1.801 and $1.625 | Pullback toward the EMA cluster | N/A |
Can ATOM Reach $2.507?
$2.507 is the highest resistance level marked on the chart.
Reaching it would require ATOM to clear $2.034 and then $2.300 first, a multi-stage move that would likely need volume to stay elevated and RSI to cool off from overbought levels without a sharp reversal.
Cosmos Price Forecast and Outlook
ATOM's breakout out of a multi-month base is a meaningful structural shift, backed by growing attention to Cosmos's interchain roadmap.
The Cosmos price forecast leans bullish while the price holds above $1.801, with $2.034 and $2.300 as the next levels to watch.
That said, an RSI reading above 75 often precedes at least a short cooldown, so a dip back toward the breakout zone before the next leg up wouldn't be unusual.
Cosmos Price Prediction: Expert View
According to CoinGabbar analysts , This breakout has real structure behind it a multi-month base, an EMA cross, and heavy short liquidations but overbought RSI means the next few sessions matter. $1.801 is the level to watch.
Data Sources
Price, market cap, FDV, and supply data referenced from CoinMarketCap. Chart, EMA, and RSI data referenced from TradingView on OKX. Liquidation and futures volume data referenced from Coinglass. Sentiment referenced from posts by @CryptoBull009 and @iiam_Akshay on X.
Disclaimer
This piece is for informational purposes only and isn't financial advice. The levels and scenarios above are based on technical chart analysis and publicly available data at the time of writing, and crypto markets can move sharply within hours, so past patterns don't guarantee future outcomes. It's worth doing independent research and considering your own risk tolerance before acting on any of the levels discussed here.
0
0

 Manage all your crypto, NFT and DeFi from one place
Securely connect the portfolio you’re using to start.


