
Dogecoin (DOGE) And Pepe (PEPE): With Weekend Meme Volumes Jumping On CEXs And Social Feeds, Do DOGE And PEPE Kick Off A June Meme Wave Or Just Offer One More Exit Before Capital Rotates Back To RWAs And L2s?

0
0
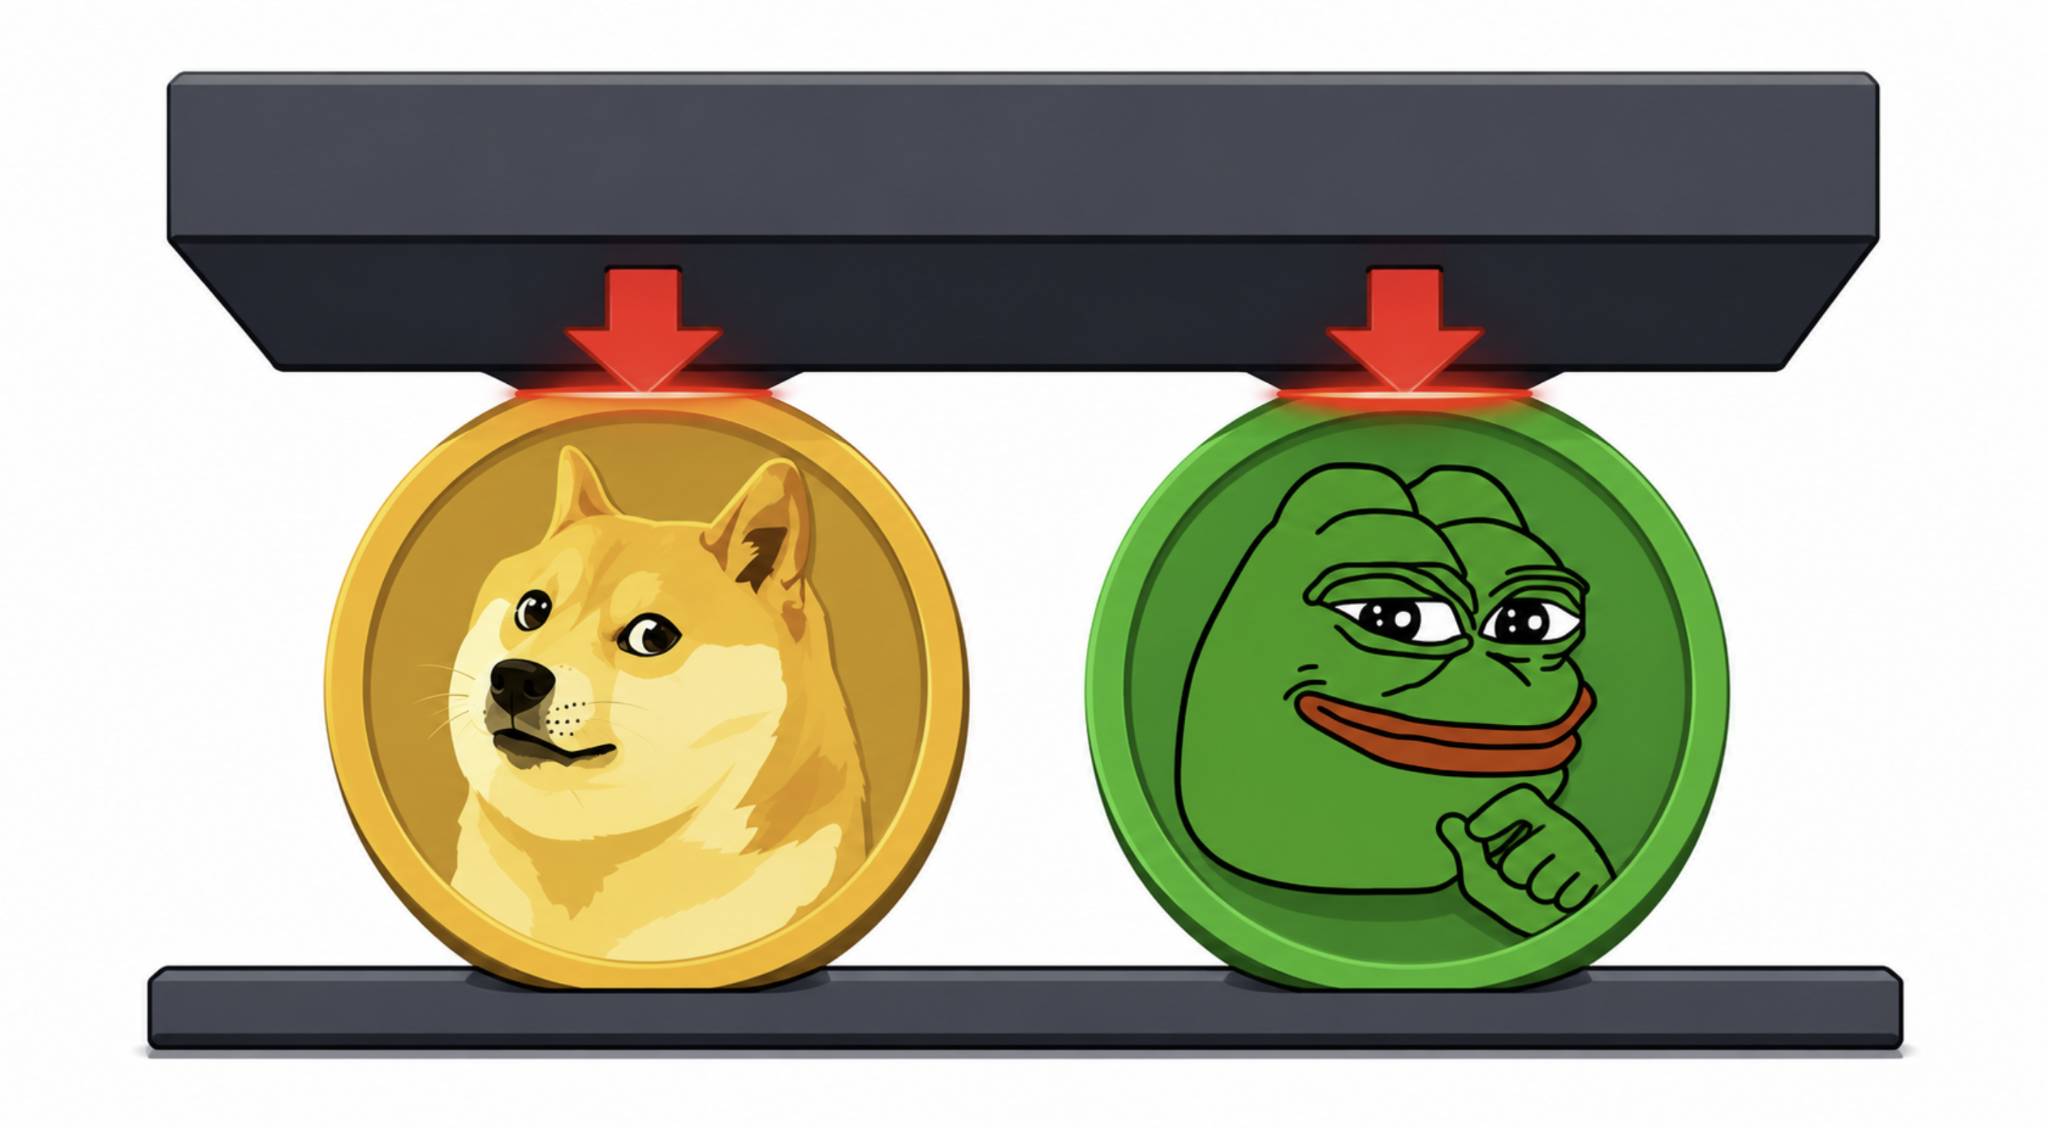
Trading desks are closely monitoring a sudden, sharp uptick in meme coin activity. Following a period of subdued price action, weekend volumes for top-tier speculative assets have noticeably jumped across centralized exchanges (CEXs) and social media feeds.
Dogecoin (DOGE), acting as the primary large-cap index meme, and Pepe (PEPE), the benchmark high-beta alternative, are both sitting at critical technical crossroads. Traders are now faced with a defining macro question: Is this sudden weekend surge the spark for a sustained June meme wave, or is it a calculated bull trap—offering one final exit window before institutional and retail capital definitively rotates back into fundamentally driven narratives like Real World Assets (RWAs) and Layer-2 (L2) infrastructure?
Dogecoin (DOGE): Index Meme In The Middle Of Its Range
Source: tradingview
Dogecoin's structural profile over the last 30 days is a textbook example of "mid-range consolidation after a big run." It is trading just below its 30-day Simple Moving Average (SMA), but comfortably above its 200-day SMA baseline ($0.130–$0.140).
The Fibonacci Map ($0.110 to $0.190):
-
23.6% Retracement: $0.129
-
38.2% Retracement: $0.141
-
50.0% Retracement: $0.150
-
61.8% Retracement: $0.159
Immediate Support:
-
$0.129 to $0.145: This is the shallow retracement cluster, housing the 23.6% and 38.2% Fibonacci levels. If DOGE is successfully coiling to kick off a June meme wave, it must hold daily closes in or above this critical band.
-
$0.110 to $0.115: The 30-day swing low. A clean daily close below $0.110 implies that the entire 30-day upward move is fully unwound, putting a much deeper structural reset on the table.
Immediate Resistance:
-
$0.150 to $0.159: The primary overhead barrier. This zone contains the 50% Fib ($0.150), the 30-day SMA ($0.150), and the 61.8% Fib ($0.159). DOGE needs to trade and hold above $0.155–$0.160 for the broader market to treat it as a new cyclical leg rather than just a weekend range bounce.
-
$0.170 to $0.190+: The local resistance and prior high. Sustained closes above $0.190 typically coincide with massive broad-market CEX volume and confirm an obvious "meme season."
The Read: Right now, DOGE is structurally fine. It is sitting in the middle of a $0.110–$0.190 box, slightly under trend but comfortably above its shallow Fibonacci supports. For a fresh June wave to materialize, the $0.129–$0.141 zone must catch dips, and the price needs to rapidly reclaim the $0.159 level. If it oscillates aimlessly below $0.160 and repeatedly fails near $0.170, it is acting primarily as a volatility vehicle for latecomers before capital rotates elsewhere.
Pepe (PEPE): Higher Beta Meme Sitting On Shallow Fib Support
Source: tradingview
PEPE acts as a higher-beta multiplier to DOGE in both directions, and its chart perfectly reflects that volatility. Trading below both its 30-day mean ($0.0000105) and its 200-day SMA ($0.0000115–$0.0000120), PEPE is exhibiting a much more fragile "mid-down-leg" profile.
The Fibonacci Map ($0.0000070 to $0.0000150):
-
23.6% Retracement: $0.0000089
-
38.2% Retracement: $0.0000101
-
50.0% Retracement: $0.0000110
-
61.8% Retracement: $0.0000119
Immediate Support:
-
$0.0000089 to $0.0000095: PEPE is currently leaning right on its 23.6% Fibonacci retracement ($0.0000089). This band is the very first place you expect dip buying to occur if the prior move to $0.0000150 is still being actively defended by bulls.
-
$0.0000070 to $0.0000075: The 30-day swing low. A daily close under $0.0000070 is a severe warning signal that the entire leg is unwinding and overall meme risk appetite has deeply faded.
Immediate Resistance:
-
$0.0000101 to $0.0000110: PEPE's "trend repair" band. This cluster holds the 38.2% Fib, the 50% Fib, and the 30-day SMA. Reclaiming and holding this specific block would prove that buyers are willing to step up and pay mid-range prices again, confirming the weekend momentum.
-
$0.0000119 to $0.0000150: The 61.8% level and local high. A move into this region with sustained volume—not just a fleeting wick—is required to confirm a genuine June meme wave.
The Read: PEPE is currently far more fragile than DOGE. It is leaning precariously on shallow Fib support directly beneath its 30-day moving average. To be part of a fresh macro leg, it must hold the $0.0000089 line on closes and immediately reclaim $0.0000110 to pull its moving average back underneath the price. If it drifts under $0.0000089, the current weekend flows are highly likely to be late entries being let out.
Conclusion: A June Meme Wave Or One More Exit?
The structures dictate clear terms for both assets. DOGE is structurally healthy but lacking sustained momentum, while PEPE is highly vulnerable to another leg down if the weekend risk appetite does not drastically improve.
They Kick Off A June Meme Wave If:
-
DOGE firmly holds the $0.129–$0.141 support, reclaims the $0.150–$0.159 resistance block, and pushes convincingly toward $0.190 backed by strong CEX and perpetual futures volume carrying over into the trading week.
-
PEPE defends $0.0000089, reclaims the $0.0000101–$0.0000110 trend repair band, and tests $0.0000150 alongside broad meme participation.
-
Social feeds reflect sustained retail engagement and fresh capital inflows that noticeably outpace the capital rotating into RWA protocols and Ethereum L2 ecosystems.
They Offer One More Exit Before Rotation If:
-
DOGE cannot sustain any momentum above $0.150–$0.159, eventually fading back through support toward $0.130 as the weekend volume dries up.
-
PEPE fails at the $0.0000101 resistance and eventually breaks the $0.0000070 floor.
-
The broader market clearly shifts gears, with institutional and smart retail capital firmly rotating into yield-bearing Real World Assets (like MKR/ONDO) and high-throughput Layer-2 infrastructure, leaving meme coins starved of liquidity.
Final Verdict: Based on their current placements within their respective ranges, both tokens are technically set up for possible bounces off support. However, the numbers describe assets that are strictly range-trading inside clear structural bands. Until overhead moving averages are broken on high, sustained weekday volume, this weekend jump looks more like a speculative trading window than the start of an all-out June meme mania.
Disclaimer: This article is provided for informational purposes only. It is not offered or intended to be used as legal, tax, investment, financial, or other advice.
0
0


 Manage all your crypto, NFT and DeFi from one place
Securely connect the portfolio you’re using to start.

0
0


0
0