Polkadot Price Prediction 2024-2033: A Bullish Pattern?
13d ago•

bullish:
1
bearish:
0
Share
Key Takeaways
- DOT rises despite market downturns, showcasing resilience and potential.
- Recent Sinai Upgrade bolsters network functionality and security.
Polkadot (DOT), known for its innovative multichain protocol architecture, is demonstrating significant growth and resilience in a fluctuating cryptocurrency market. Currently priced around $7, DOT has maintained a positive trajectory, outperforming many peers with a 3% increase in the past week. This performance is indicative of its robust foundation and the strong confidence investors have in its technology.
A key factor in Polkadot’s recent success is the completion of the Sinai Upgrade on its Acala Network, a critical development that has substantially enhanced the network’s functionality and security. This upgrade is part of Polkadot’s broader strategy to redefine decentralized finance (DeFi) across blockchain layers, ensuring that the platform remains at the cutting edge of blockchain technology.
Moreover, Polkadot’s potential collaboration with American soccer club Inter Miami CF, involving an $8.8 million sponsorship deal, is poised to significantly boost the token’s mainstream market presence. Such high-profile partnerships not only increase visibility but also affirm Polkadot’s market position as a leading digital asset, linked with globally recognized brands and personalities.
The strategic initiatives and continuous development within the Polkadot ecosystem make DOT a compelling investment choice. The protocol’s focus on interoperability and scalability is crucial for future blockchain applications, setting it apart in a crowded market. With these technological advancements and strategic partnerships, Polkadot is well-positioned to capitalize on the expanding blockchain and cryptocurrency sectors.
Overview
| Cryptocurrency | Polkadot |
| Token | DOT |
| Price | $7.27 |
| Market Cap | $10,436,043,867 |
| Trading Volume | $155,859,053 |
| Circulating Supply | 1,437,953,431 |
| All-time High | $11.15 |
| All-time Low | $8.40 |
| 24 High | $11.86 |
| 24 Low | $3.59 |
Polkadot Price Prediction: Technical Analysis
| Metric | Value |
| Price Prediction | $$ 23.06 (226.77%) |
| Volatility | 10.52% |
| 50-Day SMA | $8.13 |
| 14-Day RSI | 47.10 |
| Sentiment | Neutral |
| Fear & Greed Index | 69 |
| Green Days | 11/30 (37%) |
| 200-Day SMA | $7.01 |
Polkadot price analysis: Bullish trend persists as the price remains close to $7.23
TL;DR Breakdown
- Polkadot price analysis reveals cryptocurrency is going bullish as per analysis
- Price levels gain stability as the price goes above $7.23
- Support is fixed at $7.03 at the time of writing
Polkadot price analysis is giving us strong bullish signals for the day. The bullish tide has been very strong as the price levels are rising at a frequent and regular rate. The price is present at the $7.23 level which is quite an accomplishment for the buyers. Further advancement from the bullish side is expected as the support is stabilized at the $7.03 level for now, which was the previous low price.
The bulls are in full control of the market, and a potential buying opportunity is currently on offer as the price continues to remain close to $7.20. The target for the buyers should be set at around $7. However, there can be some resistance present near this level which may cause a drop in prices from here.
DOT/USD 1-day price chart: Bulls overcome bears after being grounded for a while
The given one-day price chart for Polkadot price analysis is depicting cryptocurrency value as going in a bullish direction. The day has been quite supportive for the buyers as more and more green candlesticks are securing their positions on the price chart. The price levels are rising slowly and right now the price value has reached the $7.23 level which is an appreciable recovery.
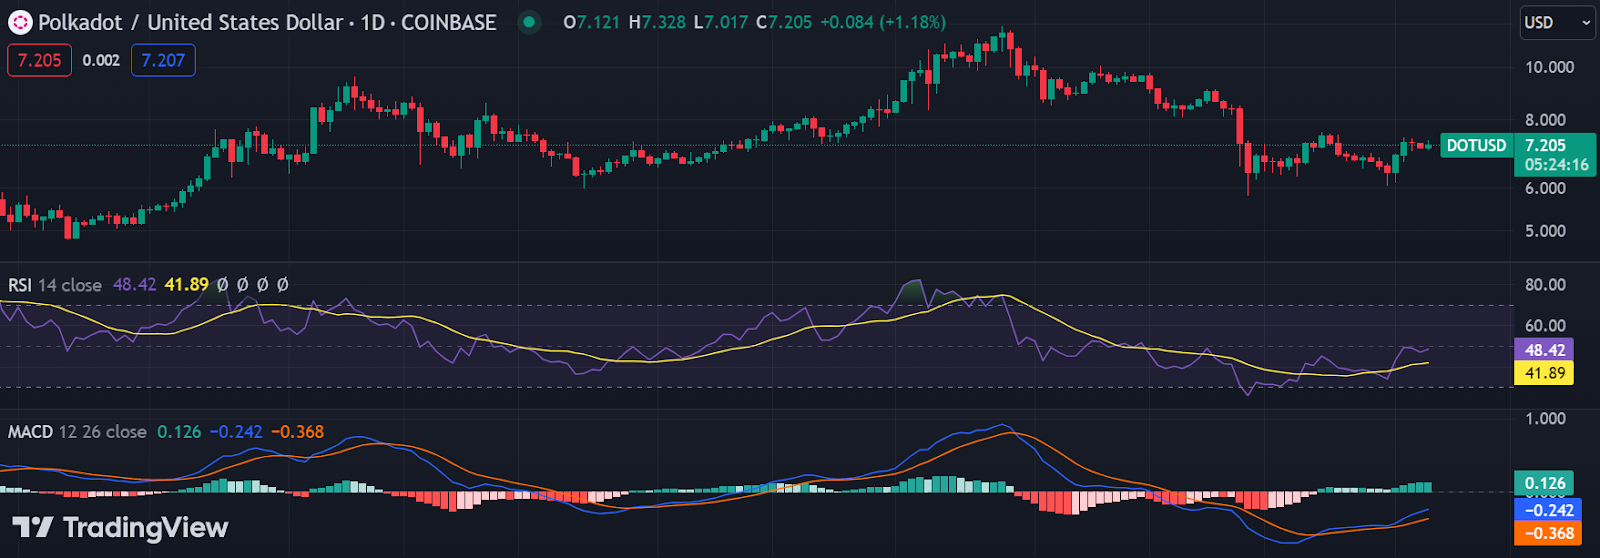
DOT/USD 1-day price chart By; TradingView
The MACD is also in the favor of the buyers as it is showing a positive crossover which indicates that there can be further advancement from here. As per the RSI, it is at 48.42 and progressing in an upward direction. This implies that cryptocurrency price has a lot of upside potential to offer and we can confidently expect some price hikes from hereon.
Polkadot price analysis: Bullish pressure results in a higher price near $7.23
The 4 hours for Polkadot price analysis is telling us that the bars have been quite high for the bulls today. The circumstances have been highly favorable for the bulls for the past several hours as the bulls are dedicated to crossing the $7.33 resistance. The Polkadot price analysis is up by 0.45% on the day and currently trading at $7.23.
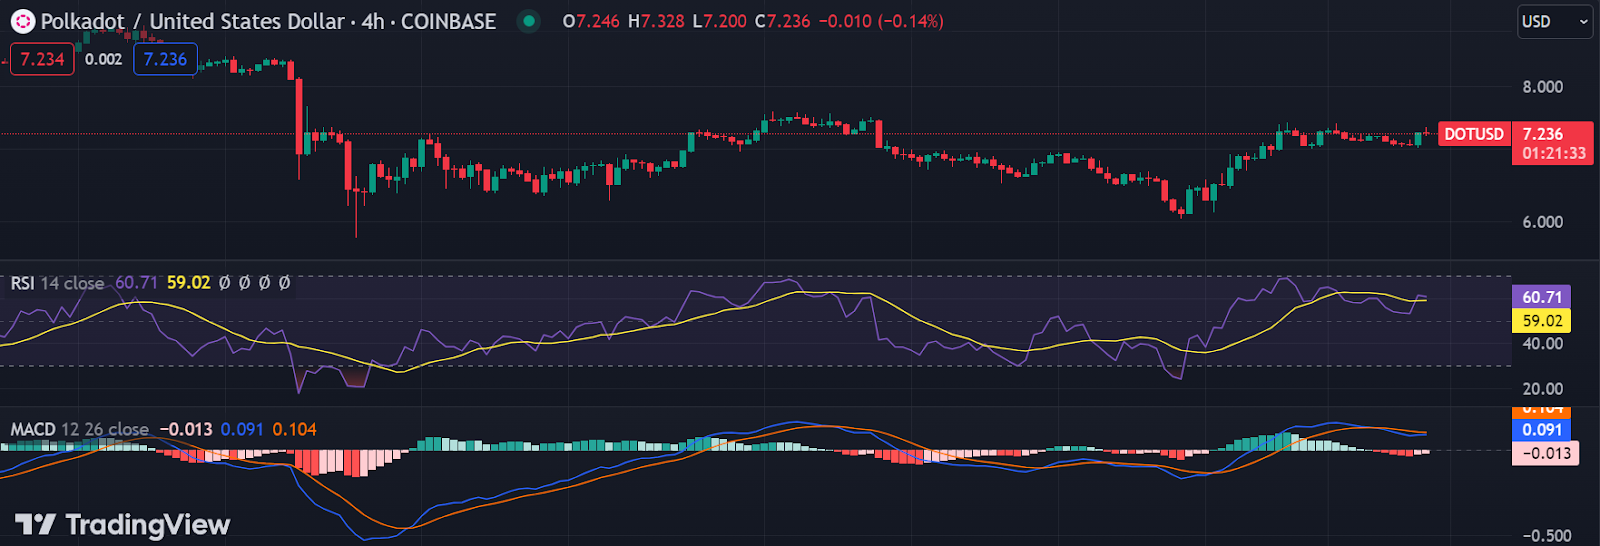
DOT/USD 4-hour price chart By; TradingView
The buyers are quite confident about their position in the market as the MACD is showing a major bullish crossover, with the red line below the blue line. The RSI is also moving close to the overbought region which means that there can be some corrections from the bullish side soon.
Polkadot Technical Indicators: Levels And Action
Daily Simple Moving Average (SMA)
| Period | Value | Action |
| SMA 3 | $7.07 | BUY |
| SMA 5 | $6.97 | BUY |
| SMA 10 | $7.25 | BUY |
| SMA 21 | $7.15 | BUY |
| SMA 50 | $8.13 | SELL |
| SMA 100 | $8.17 | SELL |
| SMA 200 | $7.01 | BUY |
Daily Exponential Moving Average (EMA)
| Period | Value | Action |
| EMA 3 | $6.85 | BUY |
| EMA 5 | $6.92 | BUY |
| EMA 10 | $7.27 | SELL |
| EMA 21 | $7.89 | SELL |
| EMA 50 | $8.40 | SELL |
| EMA 100 | $8.14 | BUY |
| EMA 200 | $7.39 | SELL |
What to expect from DOT price analysis next?
Overall, the Polkadot price analysis is quite positive and all the indicators show strong potential for growth in the near future. We can expect some major price hikes if bulls continue to dominate and breach major resistances. However, buyers should maintain a watchful eye on the market and keep a check on the rising bearish pressure.
Recent News
The staking interface for Polkadot has been transformed in its latest 1.1 update, led by Parity Technologies engineer Ross Bulat. This enhancement incorporates essential features like MetaMask integration and refined tools for managing nominations. Users can now easily evaluate validators, thanks to the introduction a two-week performance tracking system. This analytical enhancement allows for better decision-making in validator selection by providing a comparative view of their activity over a fortnight.
Polkadot Price Prediction May 2024
According to the forecast for DOT price on May, 2024, the digital asset may reach a minimum of $7.53. On the other hand, the coin may attain a mean of $7.60. The maximum price for DOT on this day is estimated to be $7.66.
The current value of DOT is $7.29, indicating an increased of 6.36% from its previous price. The value of DOT has also experienced an additional increase in the past 24 hours. Despite the market’s changing sentiment, the long-term outlook for DOT appears positive, with a projected potential value of $11.81 in 2024.
| Polkadot Price Prediction | Potential Low | Potential Average | Potential High |
| Polkadot Price Prediction May 2024 | $7.13 | $7.20 | $7.25 |
Polkadot Price Prediction May 2024
By 2024,DOT is expected to have a value range of minimum value of $8.75 to a maximum value of $10.29 on that day. The average value of the coin on that day could be around $9.11. These are the forecasts based on the current trends and fundamental factors affecting DOT.
| Polkadot Price Prediction | Potential Low | Potential Average | Potential High |
| Polkadot Price Prediction 2024 | $8.75 | $9.11 | $10.29 |
Polkadot Price Predictions 2025-2030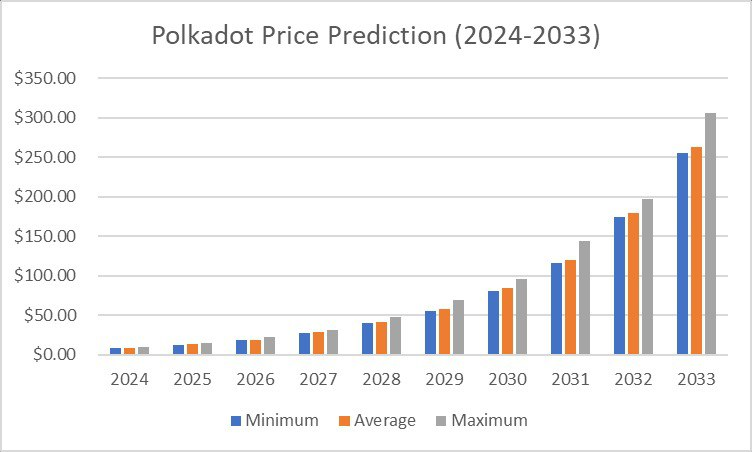
| Year | Minimum | Average | Maximum |
| 2025 | $12.66 | $13.11 | $15.16 |
| 2026 | $18.16 | $18.69 | $22.18 |
| 2027 | $27.48 | $28.23 | $31.97 |
| 2028 | $39.89 | $41.02 | $47.44 |
| 2029 | $55.69 | $57.33 | $68.66 |
| 2030 | $81.24 | $84.11 | $95.71 |
Polkadot Price Prediction 2025
According to the 2025 forecast, DOT is expected to have a minimum value of $12.66 on that day. The coin may also attain an average value of $13.11. Furthermore, the highest possible value for DOT on that day is $15.16.
Polkadot Price Prediction 2026
Polkadot price is forecast to reach a lowest possible level of $18.16 in 2026. As per our findings, the DOT price could reach a maximum possible level of $22.18 with the average forecast price of $18.69.
Polkadot Price Prediction 2027
Based on the 2028 estimation, DOT is projected to have a minimum value $27.48. The coin could also reach an average value of $28.23. Additionally, the peak value for DOT on that day is $31.97.
Polkadot Price Prediction 2028
After the analysis of the prices of Polkadot in previous years, it is assumed that in 2028, the minimum price of Polkadot will be around $39.89. The maximum expected DOT price may be around $47.44. On average, the trading price might be $41.02 in 2028.
Polkadot Price Prediction 2029
The experts in the field of cryptocurrency have analyzed the prices of Polkadot and their fluctuations during the previous years. It is assumed that in 2029, the minimum DOT price might drop to $55.69, while its maximum can reach $68,66. On average, the trading cost will be around $57.33.
Polkadot Price Prediction 2030
The price of Polkadot is predicted to reach at a minimum value of $81.24 in 2030. The Polkadot price could reach a maximum value of $95.71 with the average trading price of $84.11 throughout 2030.
Polkadot Market Price Prediction: Analysts’ DOT Price Forecast
Polkadot Price Prediction by Coincodex
According to the current Polkadot price prediction by Coincodex, Polkadot (DOT) is expected to experience a decline in the short term, with a prediction of a 6.25% drop to reach $6.37 by February 10, 2024. The current market sentiment is classified as Neutral, and the Fear & Greed Index indicates a level of 60, signifying Greed. Over the past 30 days, Polkadot has seen 47% green days and exhibited price volatility of 6.46%. Despite the short-term decline, the forecast suggests that now might be a good time to buy Polkadot. The 200-day Simple Moving Average (SMA) is expected to rise to $5.76 by March 6, 2024, while the 50-day SMA is projected to reach $6.67 by the same date. The Relative Strength Index (RSI) currently stands at 43.69, indicating a neutral market position.
Looking towards the future, the Polkadot price prediction extends up to the year 2030. For 2025, the predicted yearly low is $6.04, and the high is $14.40, suggesting a potential gain of 107.17% if DOT reaches the upper price target. By 2030, the forecasted prices range from a low of $32.09 to a high of $60.48, indicating a possible increase of 770.18% from today’s price. The moving averages, both Simple Moving Average (SMA) and Exponential Moving Average (EMA), show a mix of buy and sell signals across different periods. Additionally, various oscillators like the Stoch RSI, Stochastic Fast, and others mostly indicate neutral positions, with a few buy and sell signals, reflecting the complexity and variability in the cryptocurrency market.
Polkadot Price Forecasts by DigitalCoinPrice
DigitalCoinPrice has a bullish Polkadot prediction, as the website has given a maximum price of $14.72, an average price of $22.90, and a minimum price estimate of $23.06 for 2026.
DigitalCoinPrice forecasts a maximum trading price of $37.70, with an average value of $37.02 and a minimum value of $34.01 for 2029. According to the website’s long-term forecasts, DOT might trade at a maximum price of $72.55 in 2032 and $97.33 by 2032.
Polkadot Price Prediction by Coin Price Forecast
According to the DOT cryptocurrency price prediction from Coin Price Forecast, there’s an expectation of a significant increase in value by the end of the year, potentially rising by +19%. Midway through 2024, the forecast suggests that Polkadot (DOT) could reach a price of $7.26. Moreover, in the first half of 2025, it’s anticipated that the price of Polkadot will rise further, reaching $6.68.
Cryptopolitan’s Polkadot (DOT) Price Prediction
According to Cryptopolitan, Polkadot is all-time high is still a long way off. However, we expect Polkadot to start a cautious recovery. Throughout the year, the price is projected to trend upward.Will Polkadot manage to reach a new all-time high? In that case, the price of DOT could significantly increase.
Polkadot Price History
When looking at the Polkadot price action over the past years, we can see that its price has been heavy since the beginning of 2021. After spending most of the second half of 2020 trading around $4-$5, the price broke above the previous all-time high of $7 on December 29 and quickly reached the Polkadot price projection of $10.
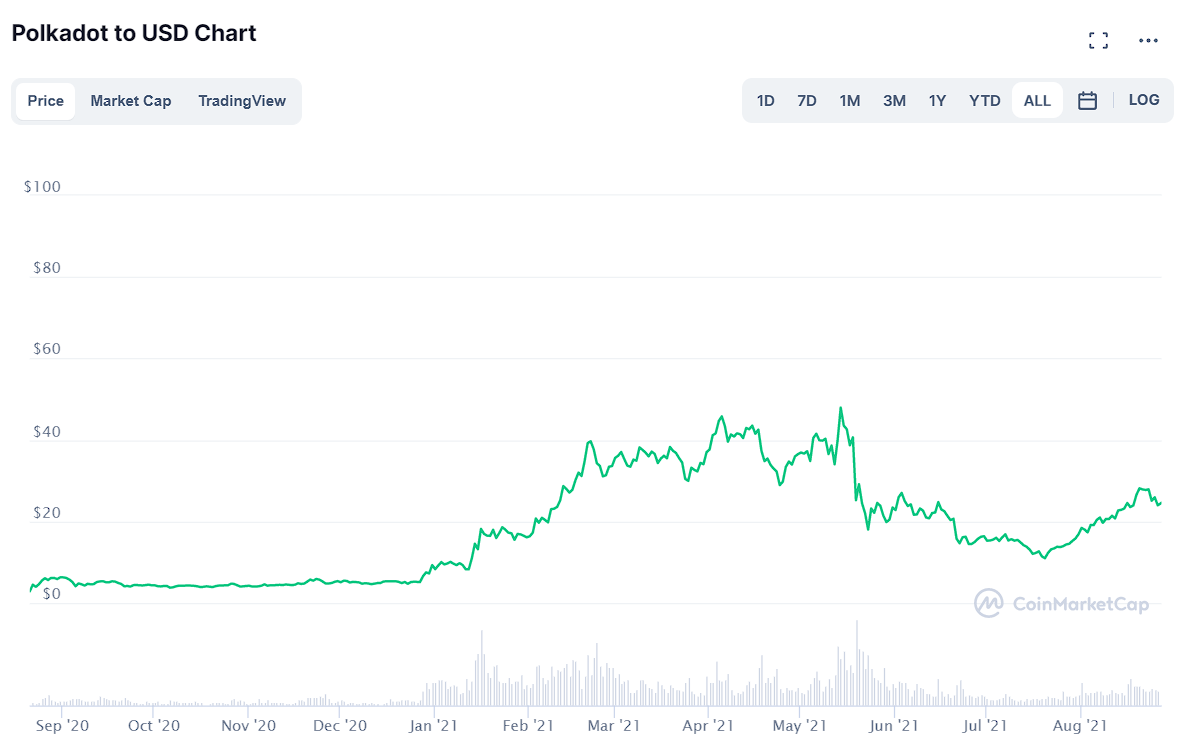
This Polkadot prediction allowed more crypto bulls to jump into the bullish trend, leading to another push after a retest of the $7 mark as support. On January 16, the DOT reached the highest day price of just over $19. From there, the bullish momentum paused for several days, and the Polkadot price consolidated for more than a week with an average Polkadot price prediction of around $17.
Around the time, the DOT price increased for many analysts, creating more interest in the Polkadot ecosystem. Polkadot forecast frequently mentioned the $40 mark as the next target for the following weeks.
This Polkadot price prediction was later reached as the crypto rallied further together with the Bitcoin price in February and eventually peaked around the maximum price of $42.
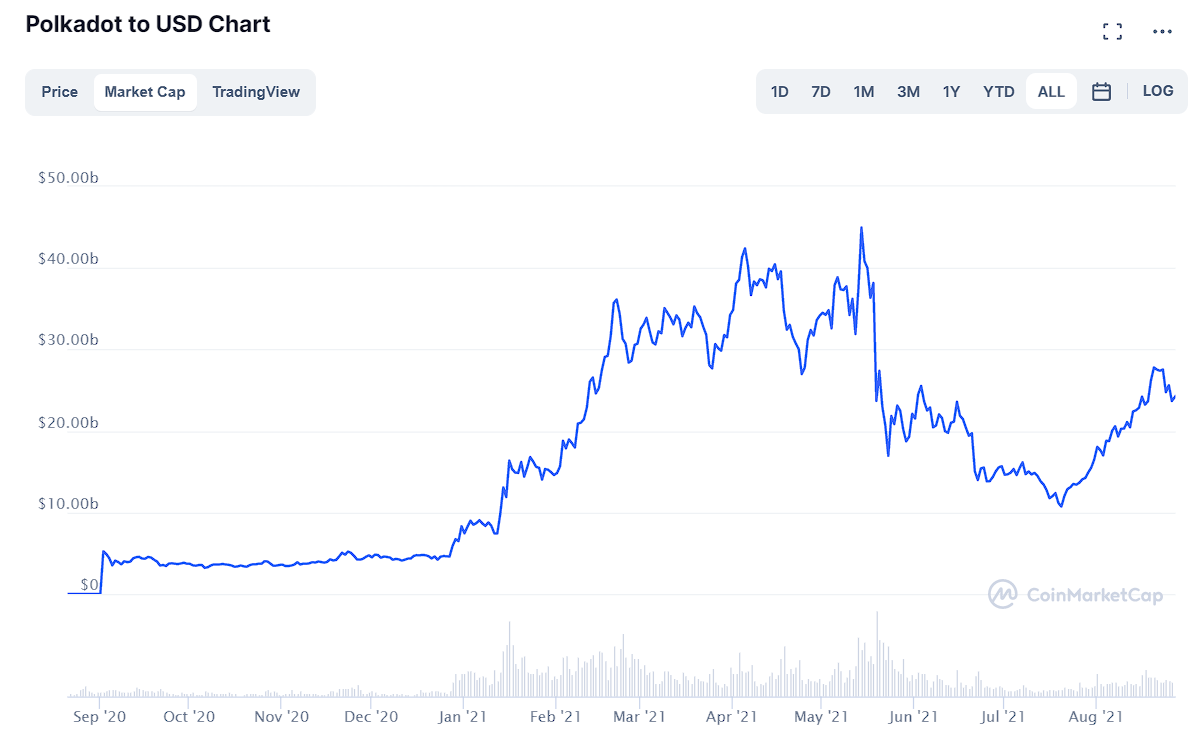
On April 3, its price finally set a clear higher and briefly reached the maximum of $46.74. However, the further upside was quickly rejected, and the momentum promptly reversed to retest the previous all-time high of $40 as a support.
Also Read:
• How To Stake Polkadot • Polkadot price analysis: DOT faces a minor pullback towards $5.0 after a bearish drive
13d ago•
bullish:
1
bearish:
0
Share

 Manage all your crypto, NFT and DeFi from one place
Securely connect the portfolio you’re using to start.

bullish:
0
bearish:
0


