
Prom Price Prediction: Long-Term PROM Price Forecast and Outlook

0
0

PROM just ripped higher out of nowhere, and the chart is telling two very different stories depending on which timeframe you're looking at.
Why Is Everyone Suddenly Watching This Small AI Token Again?
Prom price prediction searches are spiking for a reason, joining a wave of trending crypto price predictions this week. A quiet token just woke up.
It didn't creep higher. It jumped.
And when that happens, people want to know if it's the start of something or a trap. That's the question we're digging into here.
Turns out, the answer depends on which chart you trust.
On one hand, you've got a token that spent months going nowhere. On the other, you've got fresh partnership news landing right as the move started, alongside a broader crypto market rally today lifting sentiment across altcoins. Coincidence? Maybe not.
We're not here to hype it up or talk it down. We're here to walk through what the data actually shows, layer by layer, and let you decide what fits your own risk tolerance.
So what's really driving this, and does it have legs?
Key Takeaways
-
Direction: Short-term momentum is strongly bullish, but it's stretched. Long-term structure is still unresolved.
-
Why it's moving: A sharp volume spike tied to fresh ecosystem partnership news, amplified heavily by futures leverage rather than spot demand.
-
Short-term range: Roughly $1.55 to $2.00, with $1.87 acting as immediate resistance.
-
Invalidation level: A daily close back below the $1.31 EMA breaks the current bullish structure.
Prom Coin Overview
Full project name: Prometeus Network. Ticker: PROM. Blockchain: Ethereum (ERC-20). Contract address: 0xfc82bb4ba86045af6f327323a46e80412b91b27d, verified against the PROM Etherscan token page. The CertiK audit rating sits at 3.8 out of 5.
As of this snapshot (July 20, 2026, intraday), PROM trades around $1.83 to $1.85, up roughly 33% over 24 hours, per the Prom CoinMarketCap listing. Market cap is near $33.3 to $33.5 million, with a fully diluted valuation close to $35.3 million. The circulating supply sits at 18.25 million PROM against a total and max supply near 19.25 to 20 million, depending on the source.
That's the setup. Now let's get into what it means.
Technical Analysis: PROM Price Prediction Right Now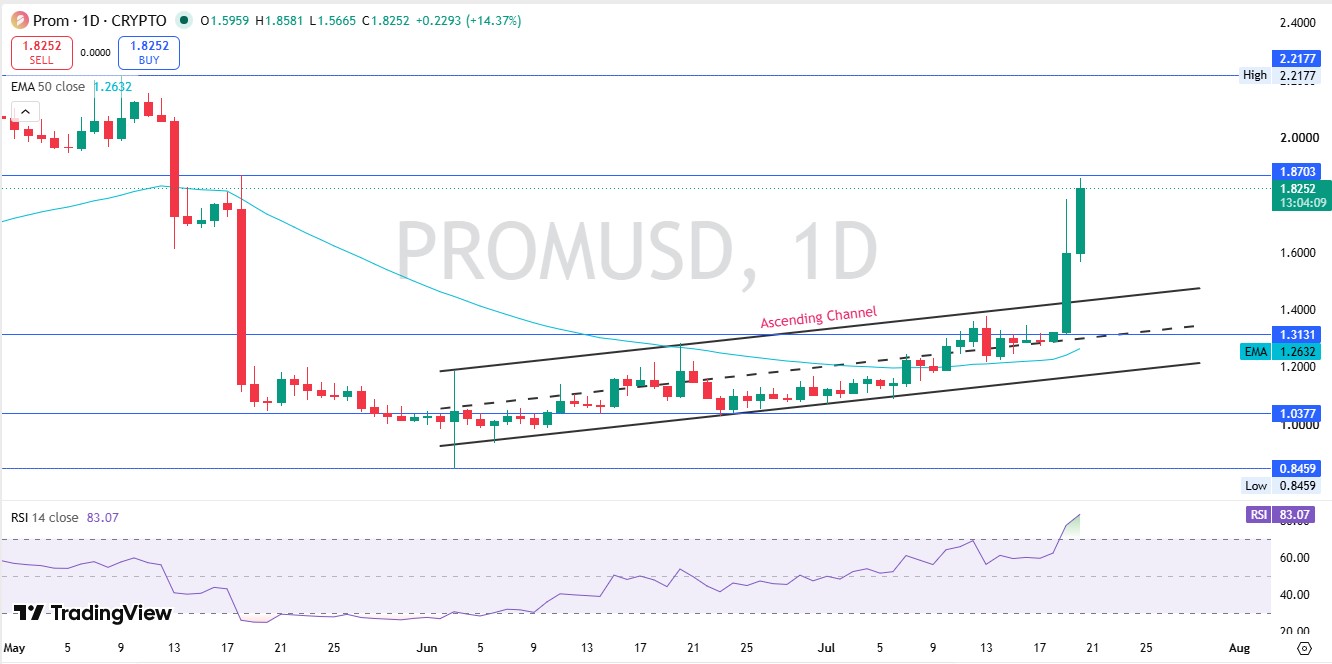
Source: Charting by TradingView
Here's the thing: the short-term trend is up, and it's up hard, an ascending channel pattern showing up across several altcoin price predictions right now. But it's overbought.
Daily RSI sits at 83, deep into overbought territory. That doesn't mean an instant reversal, but it does mean the easy gains may already be behind us.
Key support sits at $1.31, the daily 50 EMA. Below that, $1.04 comes into play.
Resistance is $1.87 first, then the bigger weekly ceiling near $2.17.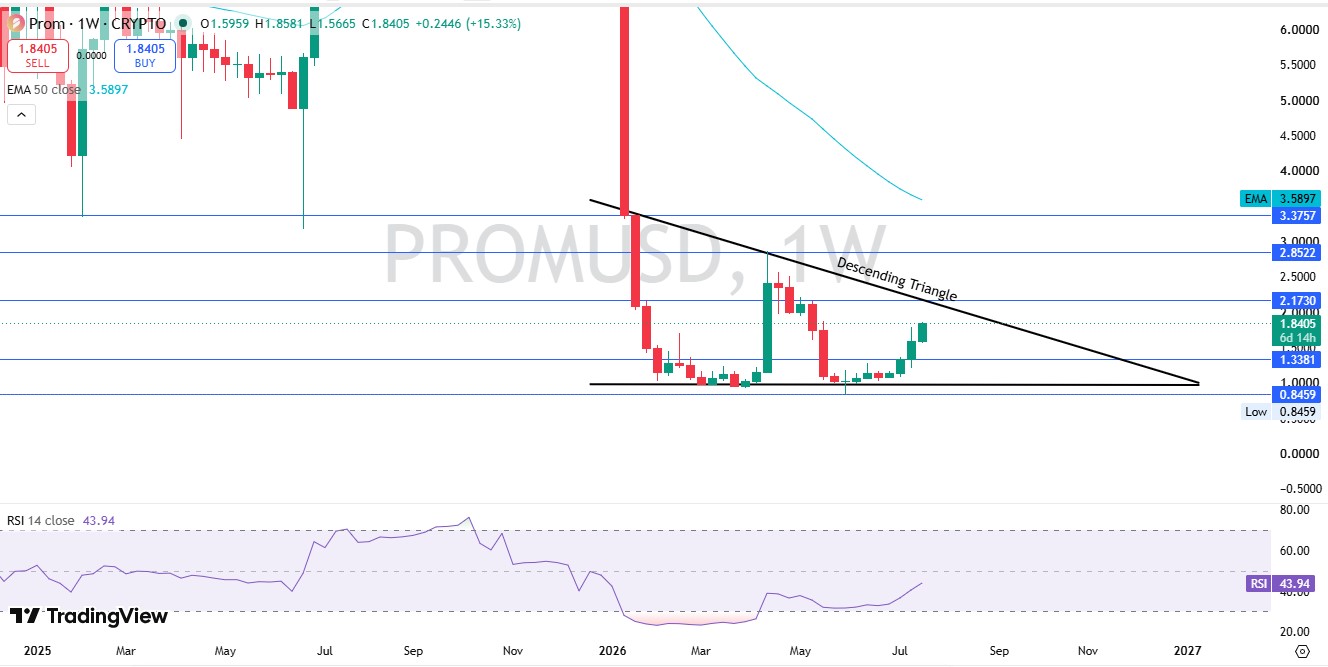
Base case for the long-term forecast: a choppy, higher-range consolidation between roughly $1.30 and $2.50 over the coming months, with a real shot at testing $2.85 to $4.00 if the weekly descending triangle finally breaks. Invalidation for the bullish thesis is a weekly close under $0.85.
That's the headline. Everything below is the "why."
What Happened: The Move In Plain Terms
PROM went from around $1.59 to a high of $1.86 in a single daily candle. That's a 14% intraday swing on top of an already-running rally.
Zoom out to the weekly chart, and the picture gets more interesting. PROM has been stuck inside a descending triangle since early this year, with lower highs stacking against a flat support floor near $0.85 to $1.00.
This latest candle is the sharpest push against that falling trendline in months.
Volume backs it up. 24-hour volume jumped to roughly $16.5 million, up close to 1,500%, according to PROM market cap data. That's not a normal day.
Why It Happened: Reading Between The Candles
Here's where it gets more specific to this token.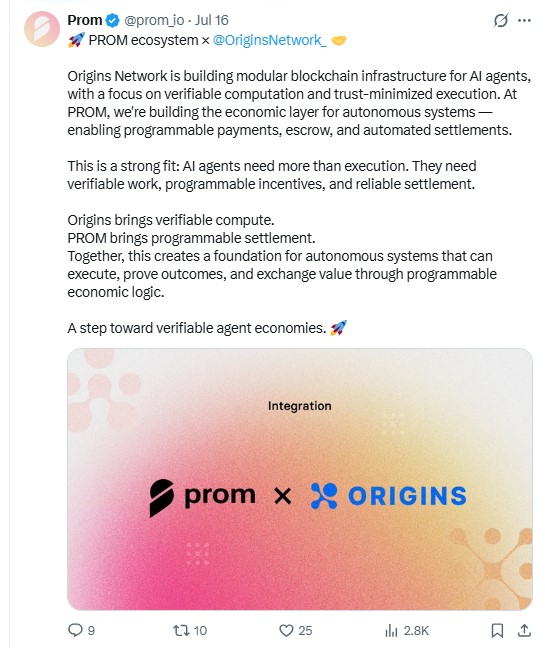
On July 16, Prom announced an Origins Network integration, a project building verifiable compute infrastructure for AI agents. The pitch: Origins handles verifiable work; Prom handles programmable settlement and payments between agents.
A week earlier, on July 9, Prom announced a Blazpay ecosystem partnership, an AI-assisted DeFi tools platform.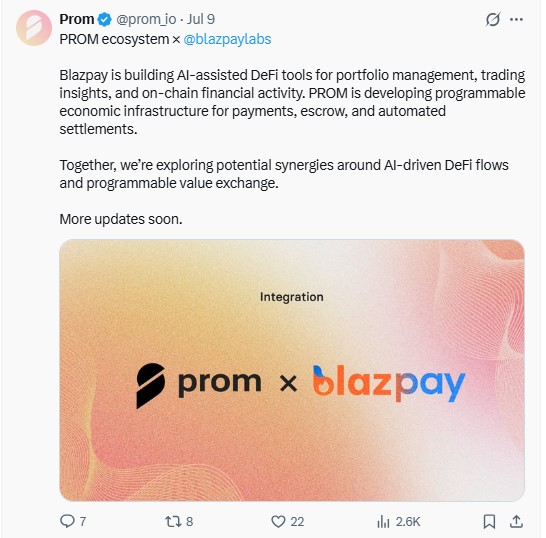
Two AI-narrative partnerships inside eleven days, landing right before a 33% daily candle. When we pulled the timeline next to the price chart, the correlation was hard to ignore.
But here's the catch worth sitting with: correlation isn't causation, and volume tells a more complicated story than the headlines do.
The Volume Problem: Spot vs Futures (Original Analysis)
This is the part a lot of coverage skips.
According to Prom futures volume data, 24-hour futures volume on PROM hit $87.62 million. Spot volume over the same window was $6.17 million.
That's a spot-to-futures ratio of roughly 1:14. In other words, for every dollar of real buying and selling on spot markets, there's around fourteen dollars of leveraged betting happening on futures.
That matters. A move built mostly on futures speculation tends to be more fragile than one built on organic spot accumulation.
The liquidation data backs this up. Over 24 hours, $288.63K in positions got liquidated, with longs taking the bigger hit at $166.31K versus $122.32K in shorts, per CoinGlass. Even inside a rally, leveraged longs are getting shaken out on the way up.
And open interest sits at $6.69 million against a $33 million market cap. That's a meaningful chunk of derivatives exposure relative to the token's actual size.
That's the risk layer. Now the supply layer.
Tokenomics: Is There Unlock Risk?
Short answer: less than you'd think for a token this size.
The circulating supply is 18.25 million PROM out of a total supply around 19.25 million (CoinMarketCap) to 20 million (Etherscan's max total supply figure). Either way, that puts somewhere between 91% and 95% of the eventual supply already circulating.
FDV sits at $35.32 million, barely above the $33.49 million market cap. When FDV and market cap sit that close together, it usually signals limited future dilution overhang.
We couldn't find a disclosed near-term unlock event tied to this token in the sources checked here. That doesn't rule one out. It means anyone trading this should verify directly on the project's own vesting disclosures before assuming there are none.
Basically, the supply-side risk here looks lower than the leverage-side risk.
On-Chain Reality: Who Actually Holds PROM?
This is where the long-term picture gets less comfortable.
Holder concentration data shows the top 100 wallets control 97.20% of supply. Whale wallets specifically, just 33 addresses, hold 87.63% of the entire token supply.
The single largest wallet alone holds 21.75% of the supply, worth close to $7.96 million at the current price.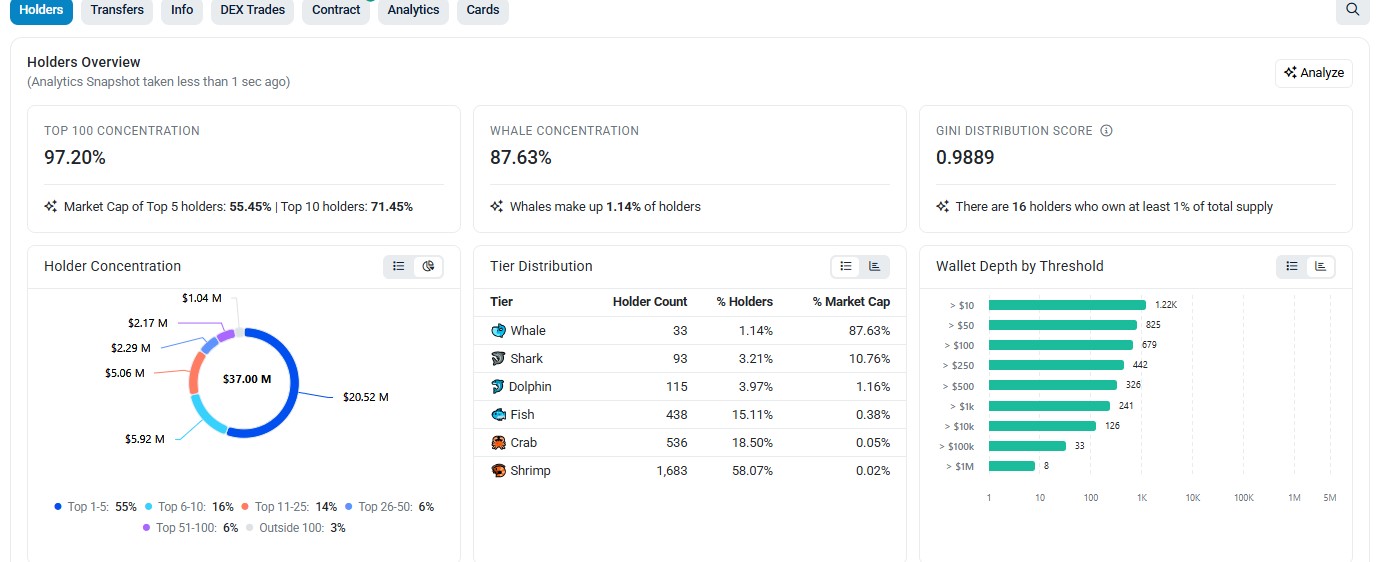
But not all of that concentration is a red flag. Two of the top ten wallets are labeled Binance hot wallets, holding roughly 17.6% combined, consistent with how large crypto exchange listings typically custody deep liquidity. That's exchange custody, not necessarily a single actor's exit liquidity.
Strip those out, and independent whale wallets still control a large majority of supply outside exchange custody. A Gini distribution score of 0.9889 confirms just how concentrated this token really is.
What does that mean for price? It means large moves, in either direction, can come from a small number of wallets deciding to act. Whales noticed first. They usually do.
Historical Context: How Far Is This From The Highs?
PROM's all-time high was $106.12, set back in April 2021. The current price is down roughly 98.27% from that peak, per PROM all-time high data.
The all-time low was $0.1005, set in November 2019. From there, PROM is up over 1,700%.
That range tells you something important: this is a token that has already been through a full boom-bust cycle and is now trying to rebuild off a much lower base. A move back toward even a fraction of the 2021 high would be a multiple of today's price, but treating that as a realistic near-term target would be reckless. It's not.
The weekly chart's more useful comparison points are the 2026 swing highs near $2.85 and $5 to $6, both of which came during sharp, short-lived spikes rather than sustained trends.
Bull, Base, and Bear Scenarios
Following a similar structure to broader Bitcoin bull-bear base-case frameworks, here's how PROM's path could split from here.
| Scenario | Conditions | Target | Timeframe | Invalidation |
|---|---|---|---|---|
| Bull Case | Weekly close above the descending triangle resistance near $2.17 to $2.85, sustained spot volume growth (not just futures), continued AI-narrative partnerships translating into real usage | $3.50 to $5.00 | 6 to 12 months | Weekly close back below $1.87 after a breakout attempt fails |
| Base Case | Price chops inside a widening range as leverage unwinds and spot demand slowly catches up; no major unlock or exploit event | $1.80 to $2.50 | 3 to 9 months | Daily close below $1.31 signals the base case is weakening |
| Bear Case | The futures-driven rally unwinds fast; whale wallets distribute strength, and the broader market turns risk-off | $0.85 to $1.04 | 1 to 4 months | Recovery requires reclaiming and holding $1.31 on a weekly basis |
The bear case here isn't hypothetical. With futures volume outweighing spot by 14 to 1, and whale wallets controlling the majority of supply, a fast unwind is a real possibility, not a tail risk.
What Would Actually Invalidate This Long-Term Thesis?
A normal pullback looks like PROM cooling from $1.85 back toward $1.55 to $1.65 while staying above the daily EMA.
A thesis-breaking move looks different. That's a daily close below $1.31, especially on rising volume, or a weekly close below $0.85, the floor of the multi-month base.
Bullish confirmation, on the other hand, means a weekly close above $2.17 with spot volume actually leading the move instead of following futures.
Main Risks To Watch
Whale concentration remains the biggest structural risk, with 87.63% of supply in just 33 wallets.
Futures-led speculation is currently outpacing organic demand by a wide margin.
The unlock risk looks limited based on available data but hasn't been independently confirmed against the project's own vesting disclosures.
Regulatory and broader market risk-off conditions apply here as they do to any small-cap token, especially with ongoing EU MiCA regulation updates reshaping exchange access across Europe.
None of this is investment advice. It's a breakdown of what the data currently shows.
Methodology
Price and RSI came from TradingView's daily and weekly PROM/USD charts. Supply and market cap were cross-checked against CoinMarketCap and Etherscan. Derivatives data came from CoinGlass. Holder concentration came from an on-chain holder analytics dashboard tied to the verified contract.
Support, resistance, and the 50 EMA were read directly off the chart, not rounded to arbitrary numbers. Every scenario below carries its own invalidation level. Long-term targets are speculative and assumption-dependent, not guarantees.
Data snapshot table
| Metric | Value | Source | As Of |
|---|---|---|---|
| Price | $1.83 to $1.85 | CoinMarketCap, CoinGlass | Jul 20, 2026 |
| 24h Change | +33.6% | CoinMarketCap | Jul 20, 2026 |
| Market Cap | $33.26M to $33.49M | CoinMarketCap, CoinGlass | Jul 20, 2026 |
| Fully Diluted Valuation | $35.32M | CoinMarketCap | Jul 20, 2026 |
| 24h Volume | $16.51M | CoinMarketCap | Jul 20, 2026 |
| Circulating Supply | 18.25M PROM | CoinMarketCap, CoinGlass | Jul 20, 2026 |
| Total / Max Supply | 19.25M (CMC) to 20M (Etherscan) | CoinMarketCap, Etherscan | Jul 20, 2026 |
| Holder Count | 11.04K (CMC) vs 2,896 (Etherscan) | CoinMarketCap, Etherscan | Jul 20, 2026 |
| Daily RSI (14) | 83.07 | TradingView | Jul 20, 2026 |
| Weekly RSI (14) | 43.94 | TradingView | Jul 20, 2026 |
| Daily 50 EMA | $1.2632 | TradingView | Jul 20, 2026 |
| Futures Volume (24h) | $87.62M | CoinGlass | Jul 20, 2026 |
| Spot Volume (24h) | $6.17M | CoinGlass | Jul 20, 2026 |
| Open Interest | $6.69M | CoinGlass | Jul 20, 2026 |
| Liquidations (24h) | $288.63K | CoinGlass | Jul 20, 2026 |
| Whale Concentration | 87.63% held by 33 wallets | On-chain holder analytics | Jul 20, 2026 |
| Top Wallet Holding | 21.75% | On-chain holder analytics | Jul 20, 2026 |
| Top 100 Wallet Concentration | 97.20% | On-chain holder analytics | Jul 20, 2026 |
| Gini Distribution Score | 0.9889 | On-chain holder analytics | Jul 20, 2026 |
| All-Time High | $106.12 (Apr 30, 2021) | CoinMarketCap | Jul 20, 2026 |
| All-Time Low | $0.1005 (Nov 8, 2019) | CoinMarketCap | Jul 20, 2026 |
| CertiK Audit Rating | 3.8 / 5 | CoinMarketCap | Jul 20, 2026 |
Holder counts differ between CoinMarketCap and Etherscan, likely a methodology gap between platforms. Recheck all figures against live sources before acting on them.
Disclaimer: This article is for informational purposes only and does not constitute financial, investment, or trading advice. PROM is a volatile, small-cap crypto asset, and prices can move sharply in either direction without warning.
Nothing in this piece should be read as a guaranteed outcome or a personalized recommendation to buy, sell, or hold. All price targets, support and resistance levels, and scenarios are speculative estimates based on the data available at the time of writing, not certainties.
Always verify current price, volume, and on-chain data against live sources before making any decision, and consider speaking with a licensed financial advisor if you need personalized guidance. Do your own research.
0
0

 Управляйте всей своей криптовалютой, NFT и DeFi из одного места
Безопасно подключите используемый вами портфель для начала.


