
Chainlink Price Prediction: BlackRock News, LINK Eyes New ATH

0
0
Chainlink is doing something on the weekly chart that has not happened in years, and this Chainlink price prediction breaks down exactly why the timing could not be more interesting.
Just as LINK pushes through a trendline that has capped it for a long stretch, headlines are circulating about some of the biggest names in traditional finance sitting at the same table as Chainlink's own founder.
When a technical breakout lines up with institutional attention like this, it tends to grab the market's full focus, so here is everything worth knowing about where LINK could head next.
LINK Price Today: Live Data and 24-Hour Change
Chainlink is currently changing hands around 11.38 dollars, with the weekly candle showing a move from an open near 11.19 to a high of 11.435 and a low of 11.110, up about 1.66% in the week.
On a 24-hour basis, CoinGlass data shows a slight pullback of around 1.14%, putting LINK closer to 11.379 dollars in that snapshot, a reminder that short-term dips are still playing out inside a larger structural move.
The broader footprint behind Chainlink remains substantial. Market capitalization sits near 8.51 billion dollars, with open interest around 585.40 million dollars, showing that derivatives traders are heavily positioned around this move.
Futures volume over the last 24 hours came in near 362.06 million dollars, alongside spot volume of about 83.05 million dollars.
Circulating supply stands at roughly 748.09 million LINK out of a total and max supply of 1.00 billion, meaning the vast majority of Chainlink's supply is already in the market.
Source: CoinGlass, Chainlink data snapshot, September 14, 2026.
Chainlink News Today: BlackRock and Vanguard is with Chainlink
The Chainlink news cycle right now is centered on a report from BSCN, which highlighted that Chainlink founder Sergey Nazarov is set to join executives from BlackRock, Vanguard, and Sharplink at a meeting hosted by the Federal Reserve Bank on September 24. 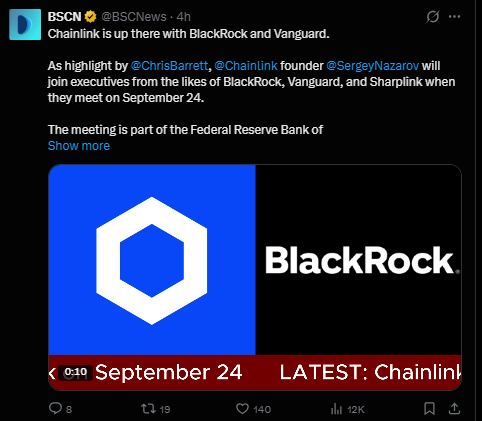
Having a Chainlink co-founder in the same room as BlackRock and Vanguard, two of the largest asset managers in the world, is the kind of headline that tends to shift sentiment fast, since it reinforces the ongoing narrative around Chainlink positioning itself as core infrastructure for institutional and tokenized finance.
This kind of Chainlink news today feeds directly into the broader Chainlink trend analysis picture, where LINK has increasingly been associated with real-world asset settlement and institutional data feeds rather than just being another altcoin.
Whether this specific meeting produces a concrete announcement remains to be seen, but the optics alone BlackRock and Vanguard names sitting next to Chainlink in the same conversation are already doing work on market psychology.
Source: BSCN (@BSCNews) on X, September 14, 2026.
Quick Take
CMP: 11.380
Weekly trigger level: break and close above 15.092
Weekly failure level: break and close below 7.150
Data as of: September 14, 2026, around 10:45 UTC+5:30
Risk note: this is a weekly timeframe setup, so confirmation takes full weekly closes, not intraday moves, and upside targets above 15.092 are wide zones rather than precise numbers
LINK Technical Forecast: A Trendline Break Years in the Making
Looking at the LINKUSDT perpetual contract on the weekly Bybit chart, the story here goes back further than most recent setups. 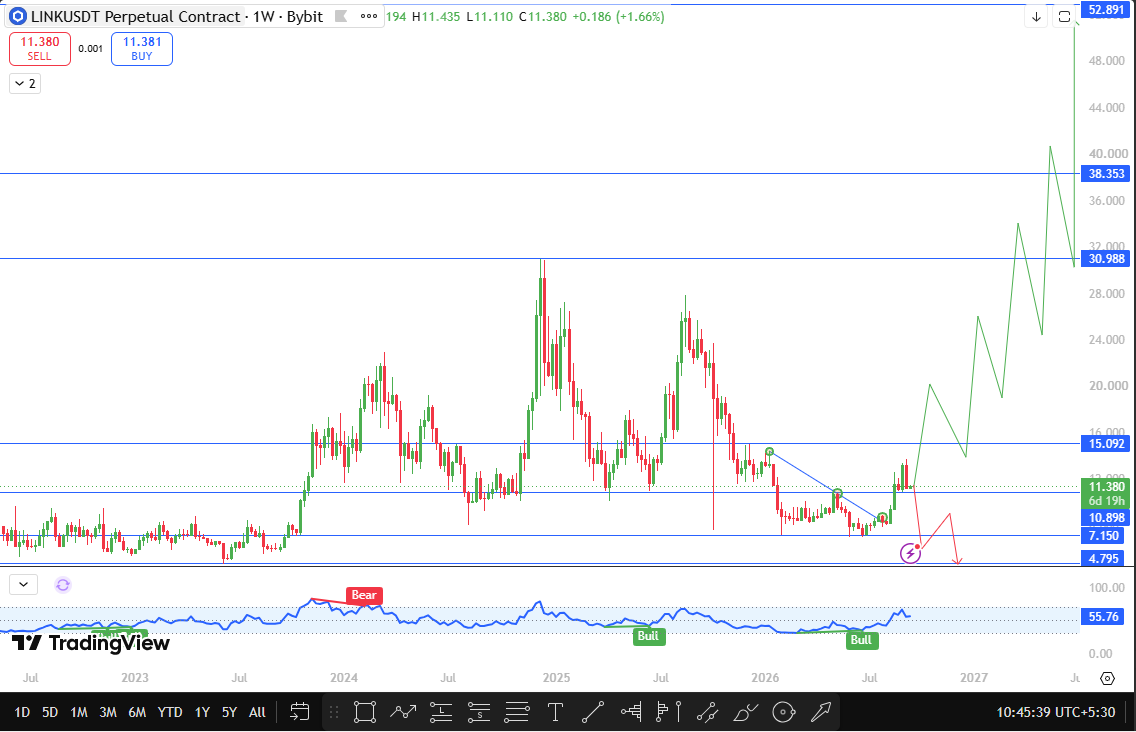
Price recently retested the exact range Chainlink had sustained between May 2022 and October 2023, and from that retest, LINK has now delivered a breakout above the descending trendline that had been capping every rally since that period.
A trendline break of this length, spanning multiple years of price history, tends to carry more technical weight than a shorter-term pattern, since it reflects a genuine shift in the balance between long-term buyers and sellers rather than a short-lived squeeze.
The weekly oscillator supports this shift too, currently sitting well above the midpoint with a bullish tag visible on a recent higher low, a contrast to the bearish divergence that had shown up much earlier during the 2022 decline.
That combination, a multi-year trendline breakout plus improving momentum, is exactly the kind of setup that shows up in a serious Chainlink technical analysis when a longer-term trend change is being considered rather than dismissed as noise.
The next major decision point sits at 15.092. If LINK manages to break and close above that level on a weekly basis, buyers are likely to become fully active, and given the BlackRock and Vanguard headlines currently in circulation, that kind of institutional attention could act as real fuel behind such a move rather than just a passing narrative.
From there, the next resistance zones line up at 30.988 and then 38.353, both of which represent substantial moves from the current price and would likely take considerable time to reach even in a strong bull scenario.
Above that, 52.891 stands out as the major resistance on this chart, largely because Chainlink's all-time high sits in that same neighborhood, making it a natural ceiling until proven otherwise.
On the downside, if the price breaks and closes below 7.150, that would suggest this breakout attempt has failed to hold, and the next support to watch would be 4.795, a level from which Chainlink could still see a bounce given how far it would represent a retracement from the current structure.
Chainlink Price Prediction: Support and Resistance Levels
Level Type | Price | Distance From CMP |
Major Resistance (near ATH) | 52.891 | +364.8% |
Resistance 2 | 38.353 | +237.1% |
Resistance 1 | 30.988 | +172.3% |
Breakout Trigger | 15.092 | +32.6% |
Current Price | 11.380 | — |
Support 1 | 7.150 | -37.2% |
Support 2 (Bounce Zone) | 4.795 | -57.9% |
Bull, Base, and Bear Scenarios for Chainlink
In the bullish case, LINK holds its recent trendline breakout and eventually delivers a weekly close above 15.092, confirming that buyers have taken control of the structure.
If that happens alongside continued positive Chainlink news, particularly anything concrete coming out of the BlackRock and Vanguard-related meeting on September 24, this Chainlink price outlook could realistically extend toward 30.988 over time, with 38.353 and the major 52.891 zone as longer horizon targets.
The base case has LINK consolidating between the 7.150 support and the 15.092 trigger level, while the market digests both the technical breakout and the institutional headlines, waiting for either a confirmed weekly close above resistance or a clear rejection back into the old range.
The bearish case plays out if 7.150 gives way on a weekly closing basis, which would suggest the trendline breakout was a false move rather than a genuine trend shift.
In that scenario, 4.795 becomes the next level to watch, and given how deep that support sits, it lines up with an area where LINK has historically found buyers willing to step back in.
Risks to This LINK Price Outlook
This is a weekly timeframe forecast, which means it plays out over weeks and months, not days, and near-term volatility can look very different from the broader trend.
The BlackRock and Vanguard connection is currently based on attendance at a scheduled meeting rather than a confirmed partnership or product announcement, so there is a real chance the news flow cools off if nothing concrete is unveiled on September 24.
Broader crypto market conditions, particularly Bitcoin dominance and overall risk appetite, can also easily override an individual altcoin setup like this one regardless of how clean the chart pattern looks.
Key Terms Glossary
Descending trendline: A downward-sloping line connecting a series of lower highs, often acting as resistance until it is decisively broken.
Weekly close: The final price at the end of a trading week, used to confirm whether a breakout or breakdown is genuine rather than a temporary wick.
Open interest: The total number of outstanding derivative contracts that remain open and unsettled at a given time.
Bullish divergence: A pattern where price makes a lower low while a momentum indicator makes a higher low, often signaling weakening downside pressure.
All-time high (ATH): The highest price an asset has ever reached, frequently acting as a strong psychological resistance zone.
Disclaimer
This article is for informational purposes only and should not be considered financial advice. Chainlink price prediction figures, LINK price target levels, and all technical analysis shared here are based on chart patterns and publicly available data at the time of writing. Cryptocurrency markets are highly volatile, and prices can move sharply in either direction without warning. Always do your own research and consult a qualified financial advisor before making any investment decisions involving LINK or any other digital asset.
0
0

 Manage all your crypto, NFT and DeFi from one place
Securely connect the portfolio you’re using to start.


