
Euler Price Prediction: EUL Rallies Hard as Short Squeeze Hits Market

0
0

Euler price prediction searches are spiking for a reason that has nothing to do with a listing announcement and everything to do with leverage getting flushed out fast. A token that had spent months grinding sideways just posted one of its sharpest moves in recent memory, and traders piling in short found themselves on the wrong side of it, more than once, across every liquidation window checked.
Is this the start of a real trend change or a squeeze that fades once the forced buying dries up? This is a question that comes up often in current crypto market rally coverage. Here is what the chart and on-chain data actually show.
Table of Contents
Key Takeaways
Token Contract
Where EUL Stands Right Now
What Is Driving EUL's Price Today
Technical Analysis: 4-Hour Chart
Technical Analysis: Weekly Chart
The Short Squeeze, In Real Time
Tokenomics and Holder Concentration
Liquidity and Exchange Volume
Bull, Base, and Bear Scenarios
Price Forecast Table
Key Risks
Glossary
Key Takeaways
EUL trades near $1.74 as of the latest snapshot, up more than 70% in 24 hours, with the weekly candle itself up nearly 87%.
The 4-hour chart broke clean out of a months-long descending channel; RSI on that timeframe reads 92.96, deeply overbought.
The weekly RSI reads just 46.04, still below the neutral midline, an unusual divergence against such a large weekly gain.
Immediate 4-hour resistance sits at $1.862, then $2.252. Support sits near $1.086, then $0.935, then $0.830.
Liquidations hit roughly $509K over both the 12-hour and 24-hour windows, meaning almost the entire day's forced selling happened in the last half day alone, and shorts took the bulk of it every time.
Circulating supply is 23.92M EUL against a 27.18M total and max supply, so a modest supply overhang still exists.
Holder data shows heavy concentration: the top 100 wallets control over 93% of the tracked supply, and a chunk of the top ten are protocol-controlled contracts rather than outside whales.
Token Contract
Contract Address: 0xd9Fcd98c322942075A5C3860693e9f4f03AAE07b
Standard: ERC-20
Security Rating: CertiK 4.4 / 5
Where EUL Stands Right Now
EUL last changed hands around $1.72 to $1.75, depending on the venue checked, up roughly 73% over the past 24 hours. The intraday range ran from a low of $0.9805 to a high of $1.75, a range also visible on CoinMarketCap's EUL listing. Volume over that window came in near $60.28M against a market cap of $41.22M, a vol-to-market-cap ratio above 126%, and extreme turnover for a token this size.
Total and max supply sit at 27.18M EUL, with circulating supply at 23.92M EUL. That leaves roughly 12% of supply still outside circulation, a modest overhang compared to fully circulating tokens but far from the kind of dilution pressure seen in earlier-stage projects, a contrast worth noting next to the vesting concerns raised in recent Ethereum price forecast coverage of token unlock schedules.
The all-time high, $15.89, was set roughly a year ago. The current price sits about 89% below that peak. On the other side, the all-time low of $0.7228 was set about four months ago, and the price now sits more than 135% above that floor. In other words, this is a token that has already crashed hard and is now bouncing aggressively off a fairly recent bottom, not a coin near its highs.
What Is Driving EUL's Price Today
There is no single catalyst announcement behind this move. Euler Labs has been actively promoting product updates around its lending markets, including tools that let users preview projected return on equity before opening a leveraged position, a feature highlighted in Euler Labs latest update, the kind of feature push that tends to draw fresh trading interest into a DeFi lending token.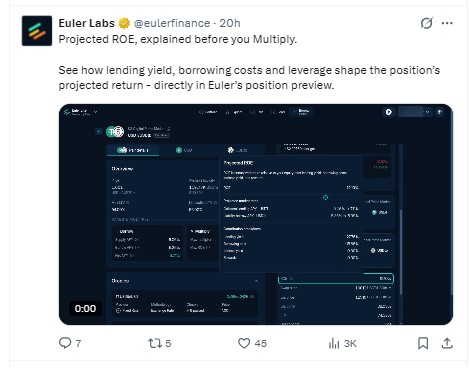
Layer that onto a broader risk-on mood across crypto this week, similar to the momentum described in the latest Bitcoin price forecast coverage, and the setup for a sharp move was already in place before the liquidation cascade added its own fuel.
Technical Analysis: 4-Hour Chart
On the 4-hour EUL/USDT chart, price spent weeks compressing inside a descending channel before a single decisive candle broke it wide open, running from around $1.475 to a high of $1.798 before settling near $1.745, a move visible on TradingView chart data. That candle alone represented an 18% move.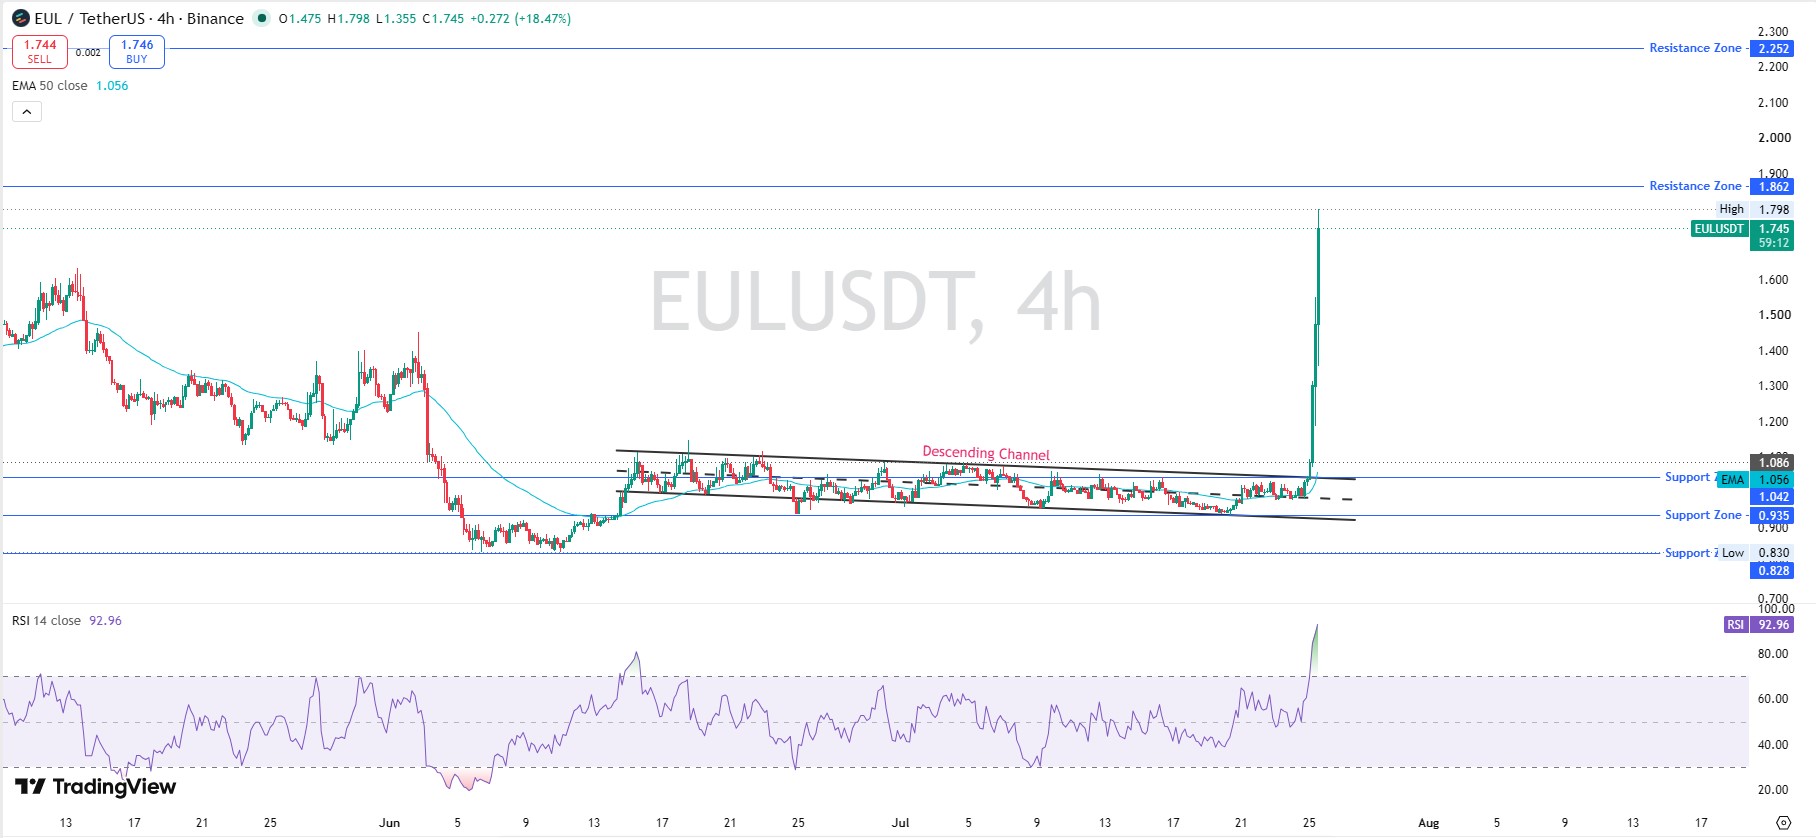
RSI on this timeframe reads 92.96, well into extreme overbought territory. The 50-period EMA sits at $1.056, far below the current price, confirming the short-term trend has turned sharply bullish but also underlining just how stretched this move already is.
Resistance sits at $1.862, with a bigger wall at $2.252.
Support underneath sits near $1.086, backed by a zone at $0.935 and a deeper floor at $0.830.
Support and Resistance Snapshot (4H)
Level Type | Price |
Resistance 2 | $2.252 |
Resistance 1 | $1.862 |
Current Price | $1.745 |
Support 1 | $1.086 |
Support 2 | $0.935 |
Support 3 | $0.830 |
Technical Analysis: Weekly Chart
Zoom out and the picture is more measured. This week's candle opened near $0.944 and is closing around $1.765, up almost 87% for the week, inside a well-defined ascending channel that has held since late last year, a structure that traces back to the momentum flagged in earlier Euler price coverage.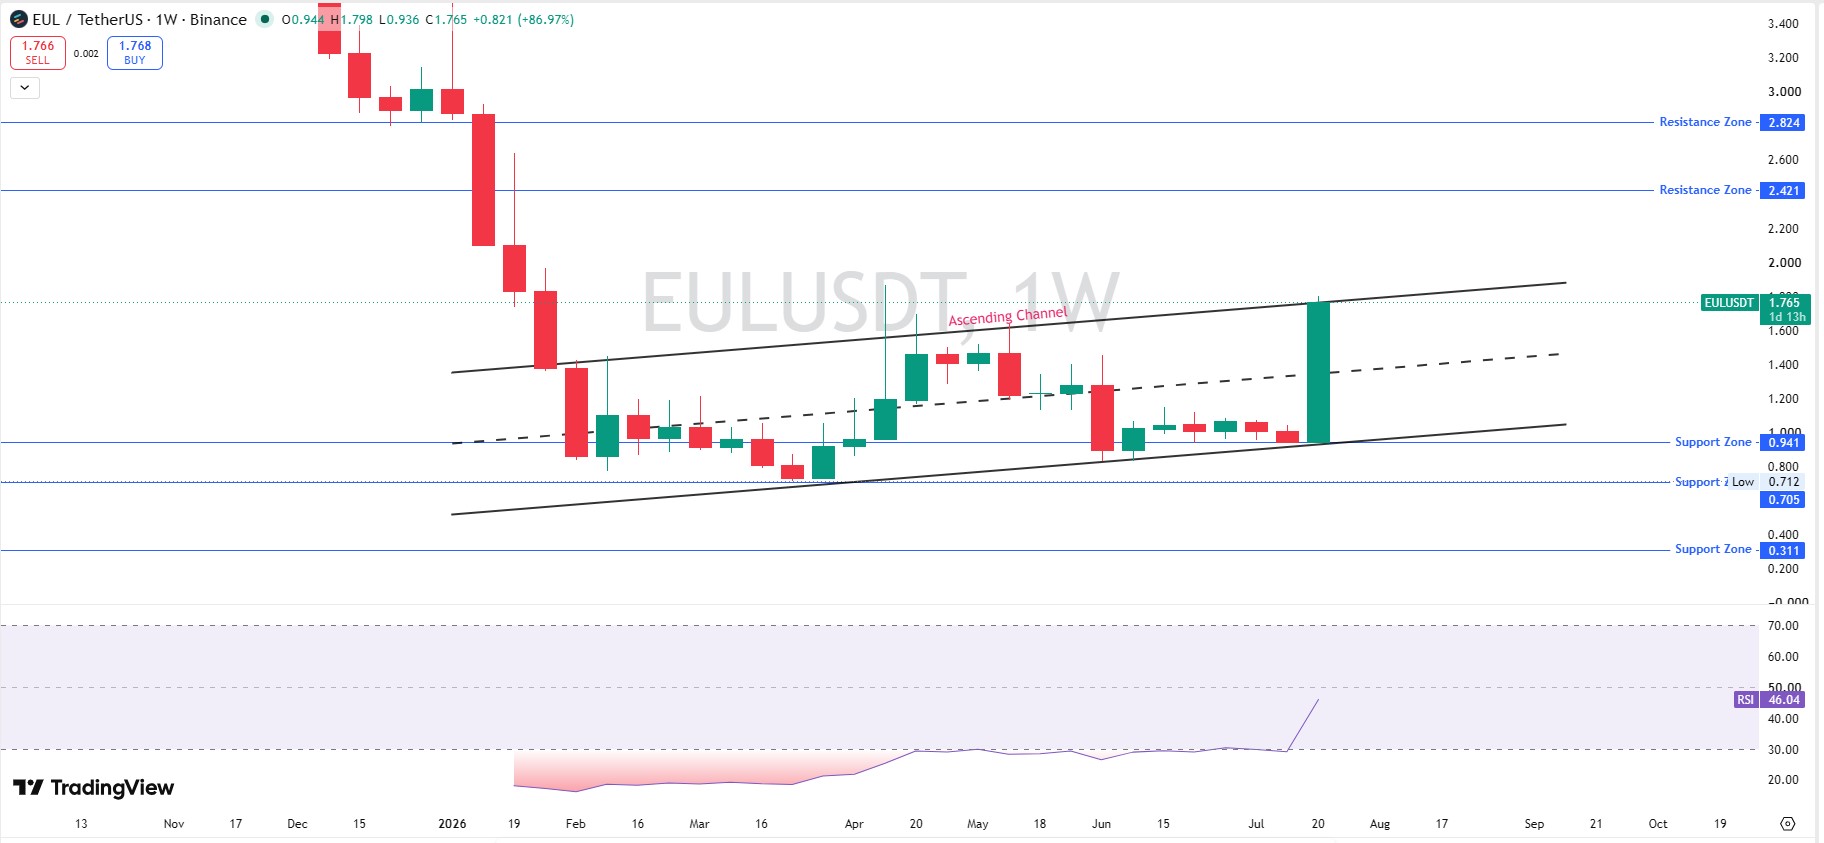
Weekly RSI reads 46.04, still below the 50 midline. That is the key tension in this chart: a huge weekly gain that has not yet even flipped weekly momentum bullish by RSI's own measure, a setup that leaves plenty of room to run if buyers keep showing up but also signals this move is very fresh.
Above the price, resistance sits at $2.421, then $2.824.
Support below sits at $0.941, then $0.712, with a deeper floor near $0.311 should the broader structure break down.
Support and Resistance Snapshot (Weekly)
Level Type | Price |
Resistance 2 | $2.824 |
Resistance 1 | $2.421 |
Current Price | $1.765 |
Support 1 | $0.941 |
Support 2 | $0.712 |
Support 3 | $0.311 |
The Short Squeeze, In Real Time
Liquidation data lines up cleanly with a squeeze narrative, a pattern that shows up clearly on the Coinglass liquidation tracker. Over the last hour, $246.95K was liquidated, with shorts eating $212.62K of that against just $34.33K in longs. Over 4 hours, total liquidations reached $452.82K, again dominated by shorts at $340.24K versus $112.58K long.
Zoom out to 12 hours and 24 hours, and the totals barely move, roughly $509.6K in both windows, meaning nearly the entire day's liquidation activity happened inside the most recent half-day. Shorts again took the larger share in both windows. That pattern, forced short covering stacked on top of organic buying, is a classic signature of a squeeze rather than slow accumulation.
Liquidation Snapshot
Window | Total | Long | Short |
1h | $246.95K | $34.33K | $212.62K |
4h | $452.82K | $112.58K | $340.24K |
12h | $509.63K | $128.36K | $381.26K |
24h | $509.65K | $128.38K | $381.26K |
Tokenomics and Holder Concentration
EUL's contract is an ERC-20 token rated 4.4 out of 5 by CertiK, with full supply and holder details visible on Etherscan token holder data. Total and max supply sit at 27.18M EUL, circulating supply at 23.92M, leaving a modest remaining unlock overhang rather than a fully diluted token.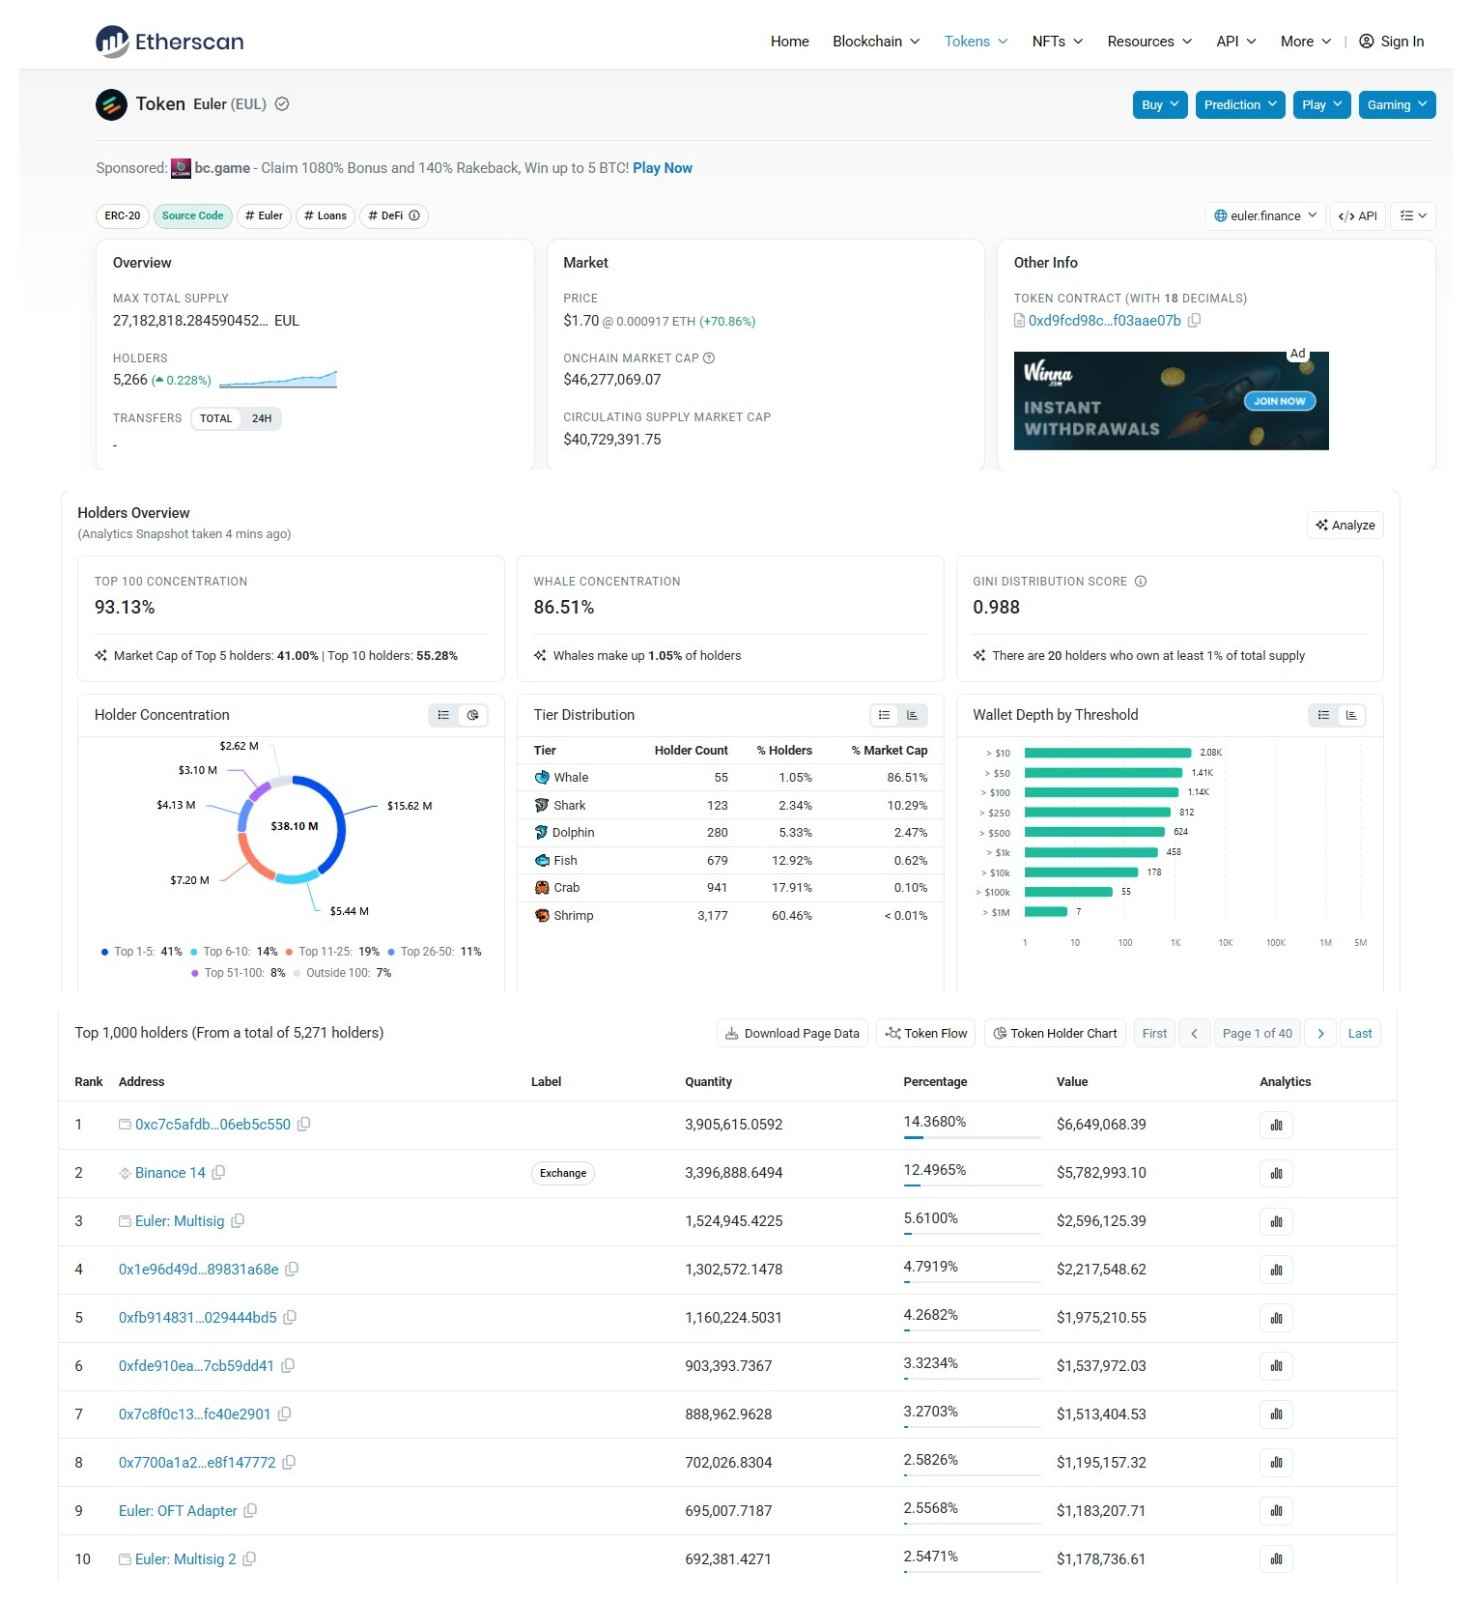
Holder data shows real concentration risk. Top 100 wallets control 93.13% of the tracked supply, and just 55 whale wallets, only 1.05% of the holder base, control 86.51% of the market cap. The Gini distribution score sits at 0.988, close to maximum inequality. Twenty wallets each hold at least 1% of the total supply.
That said, the top ten addresses are not all outside speculators. The largest is an unlabeled wallet at 14.37%, followed by a Binance exchange wallet at 12.50%, then an Euler protocol multisig at 5.61%, and further down an Euler OFT bridge adapter contract and a second multisig. A meaningful share of concentrated supply sits in exchange custody and protocol-controlled contracts rather than a single accumulating whale, a nuance worth keeping in mind before reading the raw concentration numbers at face value.
Holder Count Caveat
Total holder counts differ by source, with one analytics snapshot showing 5,271 addresses against a higher figure listed elsewhere. Anyone sizing a position should verify holder data independently.
Liquidity and Exchange Volume
Liquidity relative to market cap sits at a healthier 2.30%, better than many small-cap tokens, though futures volume is heavily concentrated on one venue. Binance leads by a wide margin, with Bybit, Bitget, MEXC, and Bitunix trailing well behind.
Futures Volume by Exchange
Exchange | 24H Futures Volume |
Binance | $91.55M |
Bybit | $14.48M |
Bitget | $9.01M |
MEXC | $5.37M |
Bitunix | $3.69M |
That kind of single-exchange dominance on the derivatives side means leveraged positioning, not broad spot demand, is doing most of the work behind this move, a dynamic often discussed alongside Bitcoin market conditions when a single venue drives most of the flow.
Bull, Base, and Bear Scenarios
None of this is financial advice. These are scenario-based estimates built from current chart structure, not guarantees, and they should be read alongside the wider crypto price prediction hub for broader market context.
Bull Case
A daily close above $1.862 opens a path toward $2.252 within 7 to 14 days. Probability is roughly 30%, contingent on the squeeze extending and weekly RSI turning above 50. Invalidation: a daily close back below $1.45.
Base Case
Price consolidates between roughly $1.10 and $1.90 over the next 7 to 30 days as the squeeze unwinds. The probability is highest, roughly 45%. Invalidation: a clean weekly close outside either boundary.
Bear Case
Momentum fades and price retraces toward the $0.935 support zone, with a deeper test of $0.830 possible within 30 days if broader sentiment cools. The probability is roughly 25%. Invalidation: sustained volume holding above $1.60 for more than a week.
Price Forecast Table
Timeframe | Bear | Base | Bull |
24H | $1.55 | $1.74 | $1.90 |
7D | $1.20 | $1.65 | $2.10 |
30D | $0.90 | $1.50 | $2.50 |
Long Term | $0.60 | $1.80 | $4.50 |
These figures are not predictions of certainty. They are ranges built around the support and resistance levels already on the chart.
Key Risks
Extreme short-term overbought conditions top the list, with 4-hour RSI near 93 leaving little room before a cooling-off period. A modest supply overhang remains, with about 12% of total supply still outside circulation. Holder concentration is severe, and while some of it sits in protocol-controlled contracts and exchange wallets, the Gini score of 0.988 still points to thin real float.
Single-exchange futures dominance means this move is currently leverage-driven rather than broad spot accumulation, and distance from the all-time high is a reminder that the longer-term trend remains a deep drawdown that has not been reversed. Sector-wide swings can override token-specific setups entirely, so EUL's chart should always be read alongside broader crypto news coverage rather than in isolation.
Glossary
RSI: A 0-100 momentum indicator. Above 70 typically signals overbought; below 30 signals oversold.
EMA: A trend-following average that weights recent prices more heavily than older ones.
FDV: What the market cap would be if every token that will ever exist were already circulating.
Gini Score: A measure of distribution inequality, from 0 to 1.
Liquidation: The forced closing of a leveraged position when losses exceed the trader's margin.
OFT Adapter: A cross-chain bridge contract that allows a token to move between blockchain networks.
Invalidation Level: The price point at which a trading thesis is considered wrong and should be abandoned.
Disclaimer: This article is for informational purposes only and does not constitute financial advice. Cryptocurrency markets are highly volatile. Always do your own research and consult a licensed financial advisor before making investment decisions.
0
0


 Управляйте всей своей криптовалютой, NFT и DeFi из одного места
Безопасно подключите используемый вами портфель для начала.


