
Polkadot Price Prediction: DOT IMP Higher High Pattern, Make or Break?

0
0

DOT has been printing higher highs and higher lows since mid-September, and it's now sitting right at the resistance zone that decides whether that structure continues.
This Polkadot price prediction looks at whether DOT clears $1.1749 to $1.1780 and pushes toward $1.2823 or fails here and breaks the structure back down.
Polkadot Outlook: Technical Analysis
Polkadot price today is trading at 1.1719, and DOT bottomed near $1.02 around September 16 and has climbed in a clean higher-high & higher-low pattern since, with each pullback finding support above the last one. 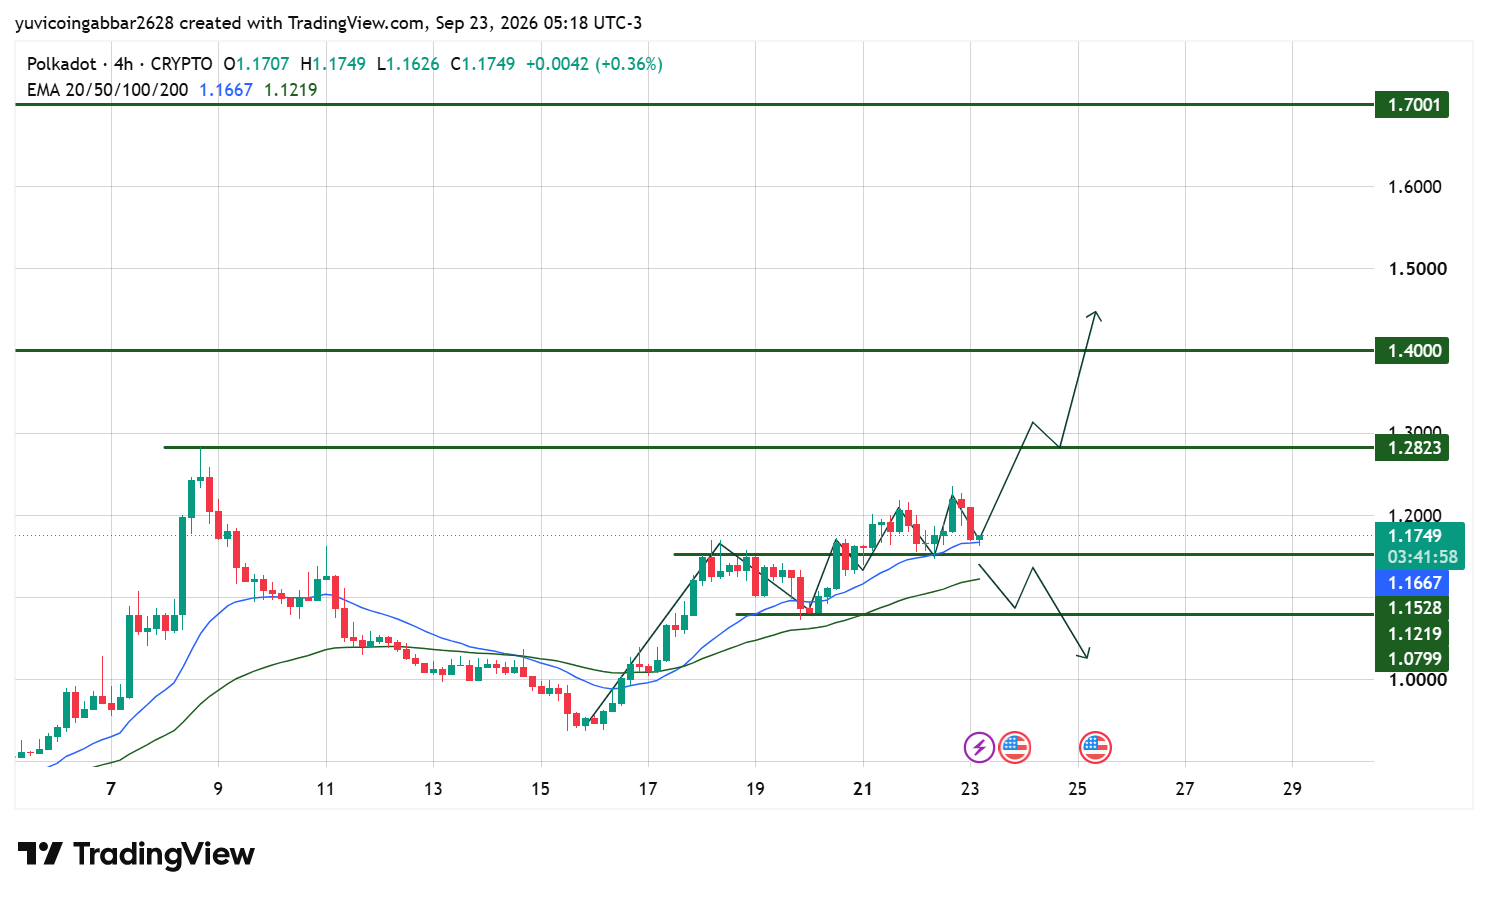
Price has now tested the $1,120.00 price resistance several times over the past two sessions without a confirmed close above it, leaving the structure at a decision point rather than a confirmed breakout.
Polkadot Forecast: IMP Key Levels
Level Type | Price |
Resistance 3 | $1.7001 |
Resistance 2 | $1.4000 |
Resistance 1 (nearest) | $1.2823 |
$1.1749 | |
First Confirmed Support | $1.1528 |
EMA Support Zone | $1.1667 to $1.1219 |
Structural Floor | $1.0799 |
Polkadot Price Forecast: What Could Happen Next?
Bull case: A confirmed close above the $1.1749 to $1.1780 zone would extend the higher-high pattern and open the path toward $1.2823, with $1.4000 as the next target if that level also gives way. Each higher low since September 16 supports the case that buyers are still in control.
Bear case: Repeated rejection at this resistance followed by a close back below $1.1528 would break the higher-low pattern and put the uptrend in doubt. Losing the EMA support zone between $1.1667 and $1.1219 would expose the structural floor at $1.0799.
Polkadot Price Today: Triggers and Invalidation Levels
Scenario | Trigger | Likely Outcome | Invalidation Point |
|---|---|---|---|
Structure continues | Close above $1.1780 | Move toward $1.2823 | Rejection back below $1.1749 |
Resistance 1 clears | Close above $1.2823 | Move toward $1.4000 | Rejection back below $1.1780 |
Structure breaks | Close below $1.1528 | Retest of EMA support zone | Close below $1.0799 |
Polkadot Price Prediction: Can DOT Reach $1.7001?
$1.7001 is the highest resistance level marked on the chart. Reaching it would require DOT to first clear $1.2823 and then $1.4000, a multi-stage move that would need the current higher-high pattern to stay intact well beyond today's resistance test.
Polkadot Price Prediction 2026: Expert View
According to CoinGabbar analysts, DOT's pattern of higher highs and higher lows since September 16 is a genuinely bullish, but repeated rejection at $1.1749 to $1.1780 shows sellers are still active at this level.
The next close is the real signal here: a break above confirms continuation, while a close back below $1.1528 would be the first sign the structure is failing.
Disclaimer
This piece is for informational purposes only and isn't financial advice. The levels and scenarios above are based on technical chart analysis and publicly available data at the time of writing, and crypto markets can move sharply within hours, so past patterns don't guarantee future outcomes. It's worth doing independent research and considering your own risk tolerance before acting on any of the levels discussed here.
0
0

 Manage all your crypto, NFT and DeFi from one place
Securely connect the portfolio you’re using to start.


