
Polkadot Price Prediction: Analyst Eyes as IMP Pattern Fired Again

0
0

Polkadot is doing this again. $DOT is trading at $1.1324, roughly flat on the day, after already climbing close to 15% within its current range on the back of a fresh channel breakout.
This isn't the first time this setup has played out either; the chart shows two earlier breakouts that both delivered strong runs.
This Polkadot price prediction looks at whether a third one is now forming and what it could mean for price.
Market data checked on September 19, 2026.
Polkadot Crypto News Today: DOT Liquidations Stay Light
Window | Total Liquidated | Long | Short |
12h | $143.07K | $123.80K | $19.27K |
24h | $378.39K | $173.55K | $204.84K |
Source: Data From CoinGlass
Liquidations are fairly balanced between longs and shorts over the past 24 hours, suggesting today's move is more about positioning inside the range than a one-sided squeeze.
DOT Technical Analysis (Repeat Channel Breakout)
DOT is trading at $1.1324. What stands out is the pattern behind this move. 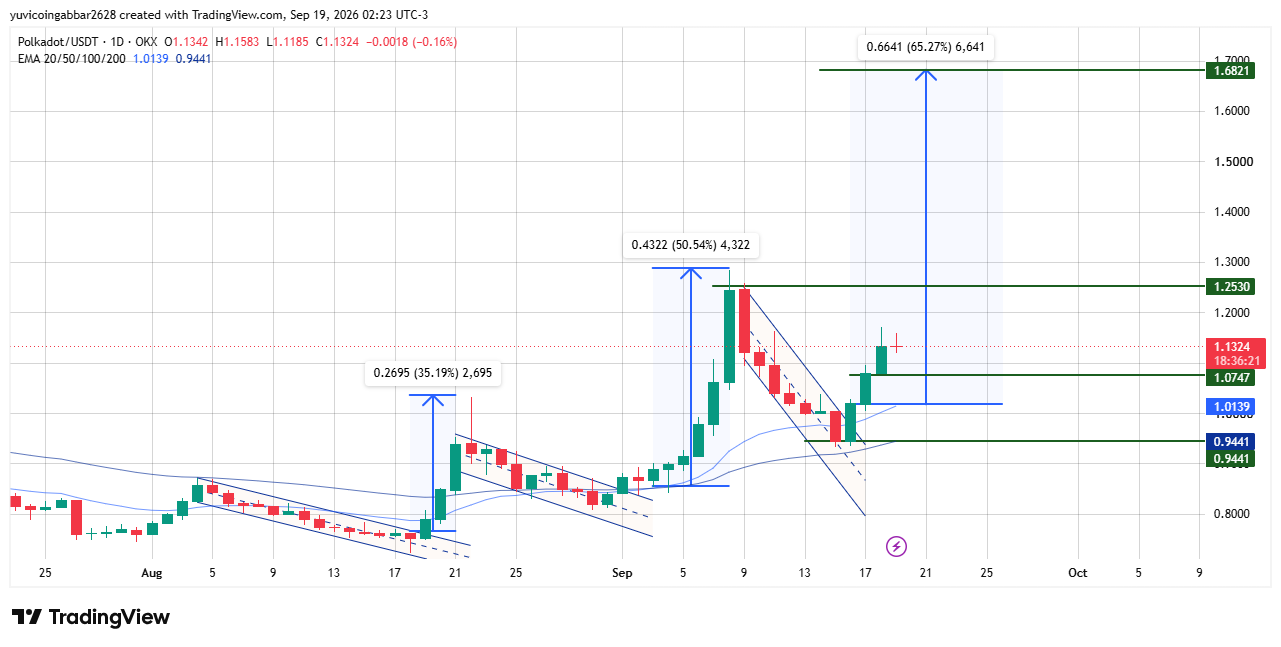
The channel breakouts on the chart: First delivered a 35.19% gain, the second a bigger 50.54% gain, and DOT has now broken out of a third falling channel, up close to 15% off this range's base already, with the tool projecting a 65.27% move if this breakout matches the size of the previous two.
The EMA cluster near $0.9441 to $1.0139 sits well below the current price and marks the deeper support zone from before this move started.
Just below the current price, $1.0747 is the level DOT broke out from, now acting as near-term support.
Above, the next resistance is $1.2530, and the chart's own projection tops out near $1.6821 if the pattern repeats.
Polkadot Price Levels: The Zones That Matter Next
Level Type | Price |
Resistance 2 (projection target) | $1.6821 |
Resistance 1 | $1.2530 |
Immediate Price Reference | $1.1324 |
Support (breakout level) | $1.0747 |
EMA Support | $0.9441 – $1.0139 |
Polkadot Outlook: What Could Happen Next?
Bull case: Holding above $1.0747 while clearing $1.2530 would keep this third breakout on track for a move toward $1.6821, matching the scale of the prior two.
Bear case: A drop back below $1.0747 and the EMA cluster near $0.9441 to $1.0139 would suggest this attempt is fading rather than repeating the earlier pattern.
Polkadot Price Prediction: Can Polkadot Reach $1.68?
Possible if this third breakout ends up matching the size of the first two, which is exactly what the chart's measured-move pattern projects.
It's a multi-stage move though DOT still needs to clear $1.2530 first before $1.6821 becomes a realistic target.
Polkadot Price Prediction 2026: Expert View
According to CoinGabbar analysts, the repeating shape of these breakouts is the most interesting part of this chart; two prior moves landed close to their measured targets, and a third is now forming from a similar setup.
Balanced liquidations suggest the market hasn't picked a clear side yet, which makes $1.2530 the level worth watching most.
Disclaimer
This article is for informational purposes only and isn't financial advice. Crypto markets are volatile, and prices can move sharply. Always do your own research before making any trading decisions involving DOT.
0
0

 Manage all your crypto, NFT and DeFi from one place
Securely connect the portfolio you’re using to start.


