Polkadot (DOT) Price Prediction 2026, 2027 – 2030: Can DOT Price Reach $60?

0
0

The post Polkadot (DOT) Price Prediction 2026, 2027 – 2030: Can DOT Price Reach $60? appeared first on Coinpedia Fintech News
Story Highlights
- The live price of the Polkadot crypto token is $ 1.60737953.
- Price predictions for 2026 range from $2.50 to $5.00.
- Structural adoption and interoperability narratives could push DOT toward $60 by 2030.
Polkadot (DOT) stands as a foundational Layer-0 blockchain, uniquely engineered to foster interoperability across a diverse ecosystem. Unlike traditional Layer-1 platforms, Polkadot’s multi-chain architecture uses a central Relay Chain to coordinate specialized blockchains known as parachains.
This model allows independent networks to share security and communicate seamlessly, leveraging the recent shift to Agile Coretime for more flexible, on-demand resource allocation.
As the industry moves toward modularization, DOT has evolved beyond a short-term trend into a permanent architectural necessity. With the March 2026 tokenomics overhaul introducing a hard supply cap and a disinflationary roadmap, the network’s economic scarcity now aligns with its technical maturity.
But how will these structural shifts and the transition to Polkadot 2.0 influence its future valuation? Let’s explore the comprehensive Polkadot price prediction for 2026–2030.
Polkadot Price Today
| Cryptocurrency | Polkadot |
| Token | DOT |
| Price | $1.6074
|
| Market Cap | $ 2,690,647,114.48 |
| 24h Volume | $ 321,501,016.8043 |
| Circulating Supply | 1,673,933,922.7840 |
| Total Supply | 1,673,559,680.3128 |
| All-Time High | $ 55.0050 on 04 November 2021 |
| All-Time Low | $ 1.1303 on 06 February 2026 |
Coinpedia’s Polkadot (DOT) Price Prediction 2026
Polkadot price (DOT) has experienced a significant “boom and bust” cycle. From late 2020 to late 2021, it surged from $1.50 to nearly $56, but after peaking, it entered a prolonged decline. By late 2023, it fell to a low of $3.57.
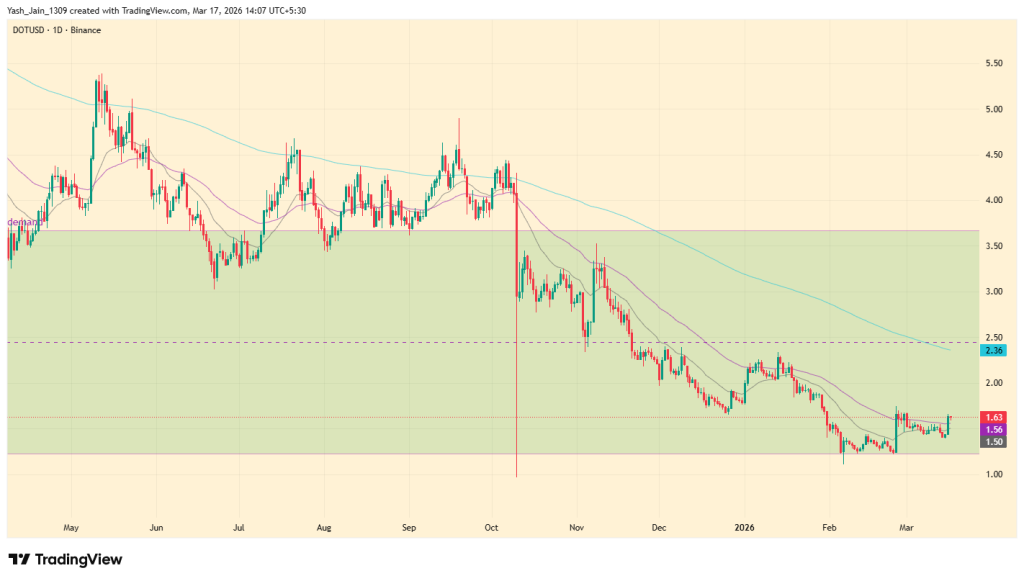
As of early 2026, DOT/USD reached a new low of $1.20, nearing the “Demand Zone” that sparked the 2020 bull run. Currently, it is in a deep accumulation phase between $1.20 and $3.57. A break above $3.57 could lead to a new long-term uptrend, but recovery may take time.
Polkadot Price Prediction March 2026
Polkadot (DOT) faced significant selling pressure, and in Q4 2025, it entered the old demand area which price continued its fall, resulting in the loss of the $2.50 level. This level is technically significant as it represents the middle band of the long-term demand area, which spans from $1.20 to $3.65.
The bearish momentum extended into the first quarter of 2026, with the price ultimately drifting toward the lower boundary of the range at $1.20 in early February. However, this level acted as a firm floor, attracting buyers and preventing a further breakdown. Throughout the remainder of February, the price began to stabilize, and March has since introduced a notable bullish reaction.
If the current momentum sustained in March continues, the immediate objective for the bulls is a reclaim of the $2.50 middle band, potentially opening the door for a move toward the upper range resistance at $3.65.
Conversely, if this buying pressure fades before reaching the midpoint, the market is likely to settle back into a prolonged period of sideways consolidation as it awaits a more definitive catalyst for a breakout.
Recent news/opinion
On March 9th, DOT announced that the first Polkadot U.S. ETF, trading as TDOT via 21Shares, has officially launched on the Nasdaq exchange. This milestone provides a regulated investment vehicle for the asset, though investors are encouraged to conduct thorough independent research, as this announcement does not constitute financial advice.
Polkadot (DOT) Price Prediction 2026
The long-term trajectory of Polkadot price (DOT) reveals a classic “boom and bust” market cycle of massive proportions. Between late 2020 and late 2021, the asset underwent an extraordinary bullish expansion, surging from a low of $1.50 to an all-time high of approximately $56. This move represented a rally of over 3,500%, establishing a dominant bullish structure on the weekly timeframe. However, the peak in late 2021 marked the beginning of a structural shift, as the market transitioned into a prolonged corrective phase.
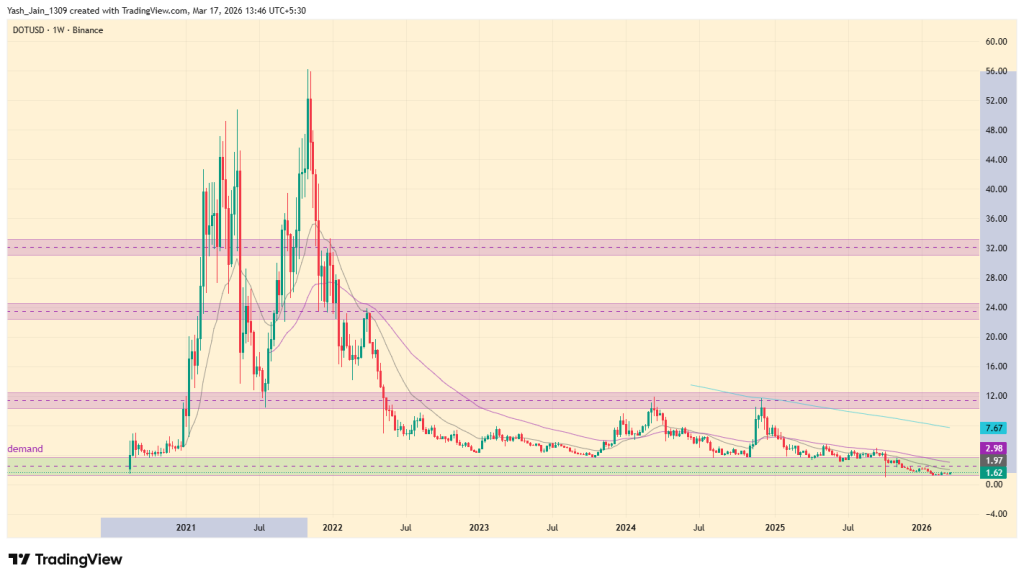
The chart shows that the bearish reversal intensified throughout 2022, characterized by the loss of critical psychological and technical support levels at $32 and $24. While a mid-2022 drop to $6.30 was initially perceived by many as a potential market bottom, it wasn’t, and the decline proved more persistent. The downward momentum eventually dragged the price to a low of $3.57 by late 2023.
Despite two notable recovery attempts in early and late 2024, the bulls were unable to reclaim the $12 supply zone, which acted as a heavy ceiling and confirmed the continuation of the macro-downtrend into 2025.
Now in 2026, all these past occurrences make sense, as by the first quarter of 2026, the correction reached a significant milestone as DOT touched a new multi-year low of $1.20. Paradoxically, this price action has brought the asset back close to the “Demand Zone” that ignited the original 2020 bull run.
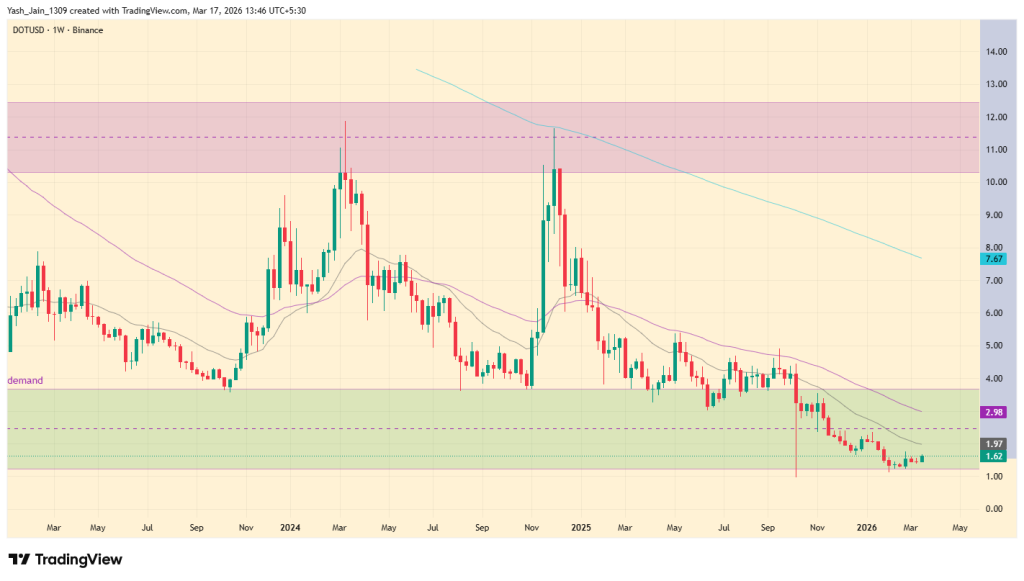
Currently, DO/USD appears to be entering a phase of deep accumulation, confined within a weekly range of $1.20 to $3.57. This historical symmetry suggests that if the price can successfully consolidate and eventually break above the $3.57 resistance, it may pave the way for a new cyclical uptrend. However, given the depth of the current range, this recovery process is likely to be time-intensive, requiring significant patience before a definitive trend reversal emerges.
Polkadot Onchain Analysis
Recent on-chain data from Token Terminal reveals a significant shift in Polkadot’s financial trajectory. After years of deeply negative earnings, the network has successfully curtailed its aggressive spending to stabilize its balance sheet.
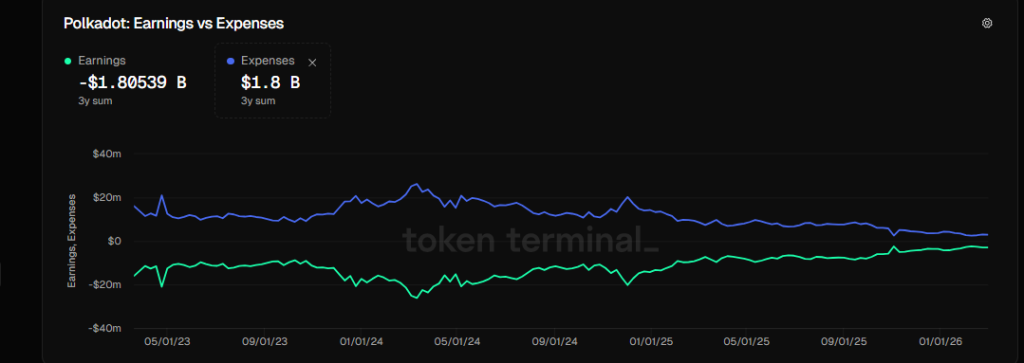
While the earnings graph is showing a clear recovery from previous lows, net figures remain slightly below the $0 threshold as the ecosystem balances its disinflationary tokenomics with ongoing operational costs.
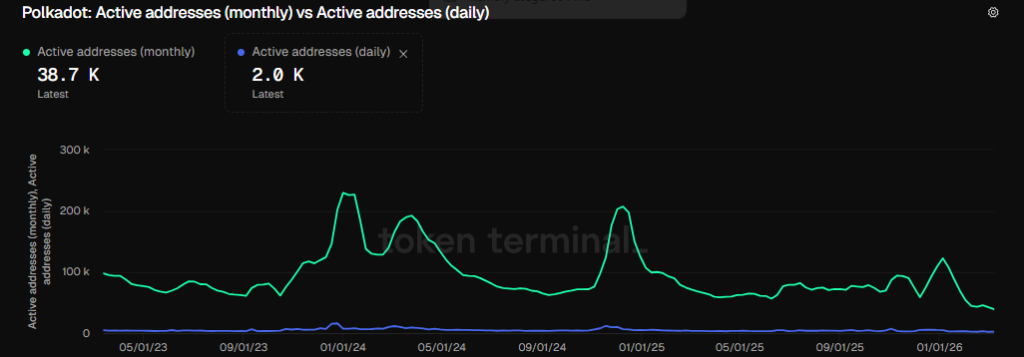
Despite this fiscal recovery, the network faces a challenge in user retention, as active addresses have continued a general downward trend. This decline in unique users suggests that Polkadot is currently struggling to regain retail momentum, leaving it susceptible to market volatility despite its improved fundamentals.
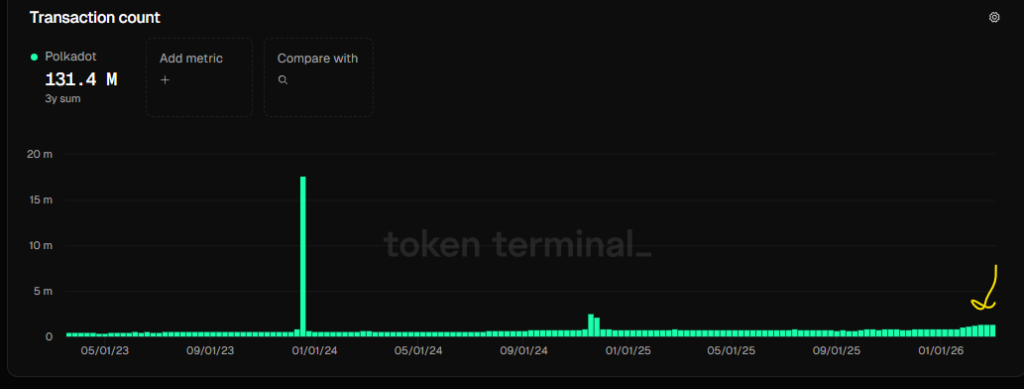
However, there is a glimmer of optimism in the latest usage metrics: transaction counts have begun to see a notable uptick in Q1 2026, indicating that while the user base may be smaller, the remaining participants are engaging more deeply with the ecosystem’s growing list of parachains.
Polkadot Crypto Price Prediction 2026 – 2030
| Year | Potential Low ($) | Potential Average ($ | Potential High ($) |
| 2027 | 4.00 | 7.20 | 10.00 |
| 2028 | 6.50 | 8.00 | 15.00 |
| 2029 | 10.00 | 14.00 | 25.00 |
| 2030 | 25.00 | 50.00 | 60.00 |
Polkadot Crypto Price Prediction 2027
Polkadot (DOT) price range can be between $4.00 to $10.00 during the year 2027.
Polkadot Prediction 2028
In 2028, Polkadot is forecasted to potentially reach a low price of $6.50 and a high price of $15.00.
Polkadot Coin Price Prediction 2029
Thereafter, the DOT price for the year 2029 could range between $10.00 and $25.00.
Polkadot (DOT) Price Prediction 2030
Finally, in 2030, the price of Polkadot is predicted to maintain a steady and positive. It may trade between $25.00 and $60.00.
Polkadot Price Prediction 2031, 2032, 2033, 2040, 2050
Based on the historic market sentiments and trend analysis of the largest cryptocurrency by market capitalization, here are the possible DOT price targets for the longer time frames.
| Year | Potential Low ($) | Potential Average ($) | Potential High ($) |
| 2031 | 50.00 | 60.00 | 80.00 |
| 2032 | 70.00 | 90.00 | 110.00 |
| 2033 | 100.00 | 130.00 | 150.00 |
| 2040 | 180.00 | 200.00 | 270.00 |
| 2050 | 250.00 | 320.00 | 400.00 |
DOT Price Prediction: Market Analysis
| Year | 2026 | 2027 | 2030 |
| Changelly | $2.50 | $3.00 | $7.00 |
| CoinCodex | $3.00 | $3.50 | $6.00 |
| Digital Coin Price | $5.00 | $7.00 | $10.00 |
Never Miss a Beat in the Crypto World!
Stay ahead with breaking news, expert analysis, and real-time updates on the latest trends in Bitcoin, altcoins, DeFi, NFTs, and more.
FAQs
Polkadot is a Layer-0 network that connects multiple blockchains, allowing them to share security and data through parachains.
Polkadot could trade between $2.50 and $5.00 in 2026, depending on market recovery, ecosystem growth, and adoption of its Polkadot 2.0 upgrades.
Price forecasts indicate 1 DOT could trade between $25 and $60 by 2030, depending on adoption of Polkadot 2.0 upgrades and broader crypto market growth.
Long-term projections suggest Polkadot could reach $180 to $270 by 2040 if the ecosystem grows steadily and blockchain interoperability becomes widely adopted.
Over the next decade, Polkadot could trade between $60 and $150+ if cross-chain adoption expands and its interoperability model becomes a core part of Web3 infrastructure.
Polkadot is seen as a long-term infrastructure project focused on interoperability, though price performance depends on adoption, ecosystem activity, and market trends.
Key factors include Polkadot 2.0 upgrades, parachain growth, tokenomics changes, institutional adoption, and overall crypto market sentiment.
0
0

 Manage all your crypto, NFT and DeFi from one place
Securely connect the portfolio you’re using to start.


0
0


0
0