
Polkadot Price Prediction: $DOT Up 10% Eyes $1.5 as ETF Stays Dormant

0
0

Polkadot is pushing higher. DOT is up over 10% today near $0.87104, breaking above a trendline that has held it down for months.
But there's a twist: the spot DOT ETF has gone quiet, with zero net inflows or outflows since June 8.
This Polkadot Price Prediction looks at whether the chart can keep climbing without institutional money showing up yet.
Market data was checked on August 21, 2026, at 14:00 IST.
Polkadot Price Prediction Today: Market Overview
Metric | Value |
Price | $0.87104 |
24h Change | +10% |
Market Cap | $1.47B |
24h Change (Market Cap) | +10% |
Unlocked Market Cap | $1.51B |
24h Volume | $130.27M+ |
24h Change (Volume) | +28.8% |
Vol/Mkt Cap (24h) | 8.81% |
FDV | $1.82B |
Total Supply | 1.69B DOT |
Max Supply | 2.1B DOT |
Circulating Supply | 1.69B DOT |
Source: Data from CoinMarhetCap as of August 21, 2026, at 14:00 IST. Figures may vary slightly across other tracking websites.
DOT Spot ETF: Still No Activity
The spot Polkadot ETF has not seen any net inflows or outflows in over two months, with its last activity on June 8, when it absorbed roughly $359,000.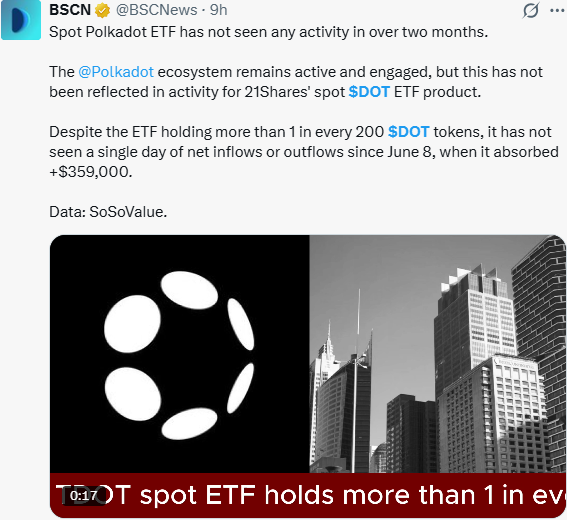
Source: Data From X
The ETF still holds more than 1 in every 200 DOT tokens in circulation, but that position hasn't moved despite the Polkadot ecosystem staying active.
This means today's rally is happening without any fresh institutional buying through the ETF, so it's being driven by spot and derivatives demand rather than ETF flows.
DOT Price Prediction Chart: Technical Analysis
Pair: DOT/USD · Market: Spot (Crypto) · Timeframe: 1D · Source: TradingView · Timestamp: August 21, 2026, 13:49 UTC+5:30
DOT closed at $0.87104, breaking above a descending trendline that had held since May.
We can get more confirmation of the bull trend if the price clears the upper resistance at $0.88525 and holds above that.
Price cleared the $0.83826 zone, which now marks the first support level, with a deeper support at $0.80743 below that.
RSI (14) sits at 65.29, showing strong momentum without being deeply overbought yet.
The EMA cluster sits below the current price, with the shorter EMA 20 at $0.79960 and the longer EMA 50 at $0.83425, both now acting as support beneath the breakout.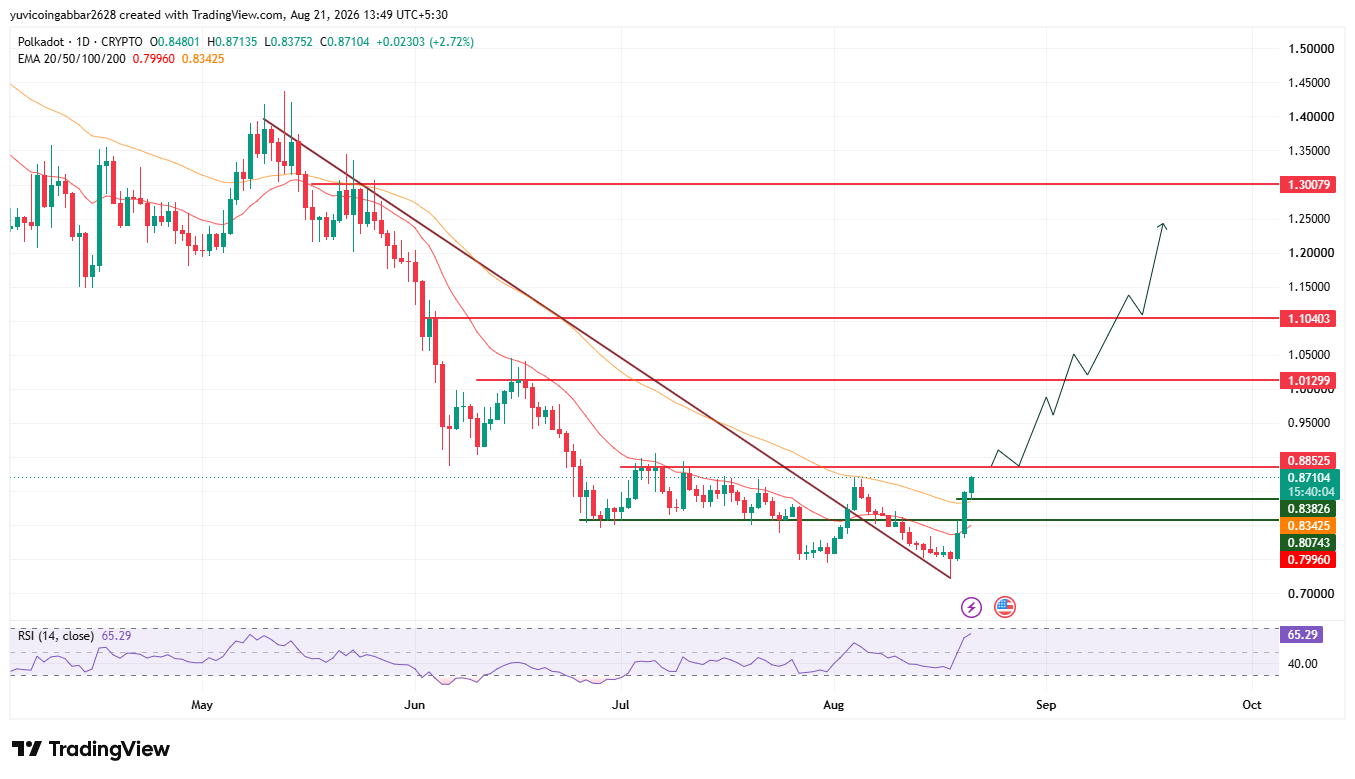
Important Key Levels
Level Type | Price |
Resistance 3 | $1.30079 |
Resistance 2 | $1.10403 |
Resistance 1 (nearest) | $1.01299 |
Immediate Price Reference | $0.87104 |
Nearest Support (breakout zone) | $0.88525 |
Deeper Support 1 | $0.83826 |
Deeper Support 2 | $0.80743 |
Polkadot Forecast: Bull Case vs Bear Case
$DOT price target 2026 Bull case: Holding above $0.83826 and the EMA cluster near $0.79960 to $0.83425 keeps the trendline break intact.
A confirmed close above $1.01299 would open the path toward $1.10403 and eventually $1.30079.
$DOT price target 2026 Bear case: A close back below $0.83826 would put the breakout in doubt, especially with no $ETF demand backing the move.
Losing $0.80743 and the EMA cluster near $0.79960 would expose the rally as a short-lived bounce.
Price Scenarios: Triggers and Invalidation
Scenario | Trigger | Likely Outcome | Invalidation Point |
Trendline hold | Price stays above $0.83826 | Push toward $1.01299 | Close below $0.83826 |
Resistance breakout | Close above $1.01299 | Move toward $1.10403, then $1.30079 | Rejection back below $0.87104 |
Pullback | RSI cools from 65.29 | Retest of EMA cluster $0.83425 to $0.79960 | Break below $0.79960 |
$DOT price target: Can DOT Reach $1.30079?
$1.30079 is the highest resistance marked on the chart.
Reaching it would require DOT to first clear $1.01299, then $1.10403, a multi-stage move that would likely need renewed ETF interest to sustain.
Polkadot Price Prediction: Expert Analysis
According to CoinGabbar analysts, $DOT just broke a multi-month downtrend on strong volume, but the dormant ETF is a reminder that this move isn't backed by institutional flows yet.
RSI at 65.29 leaves room to run before the setup looks stretched.
The $0.83826 zone is the level that matters most: holding it keeps the reversal thesis alive, while a wake-up in ETF activity could be the next catalyst to watch for confirmation.
Disclaimer
This piece is for informational purposes only and is not financial advice. The levels and scenarios above are based on technical chart analysis and publicly available data at the time of writing. Crypto markets can move sharply within hours, so past patterns do not guarantee future outcomes. It is worth doing independent research and considering your own risk tolerance before acting on any of the levels discussed here.
0
0

 Manage all your crypto, NFT and DeFi from one place
Securely connect the portfolio you’re using to start.


