
Polkadot Price Prediction: Could DOT Surprise the Bears?

0
0

Polkadot (DOT) is sitting at a pivotal point on its chart, testing support after weeks of consistent lower lows inside a descending channel.
Oversold RSI readings are starting to raise the question of a bounce, though nothing about the structure confirms one yet.
This Polkadot price prediction breaks down the channel, the derivatives backdrop, and the levels that matter most from here.
Polkadot Price Today
DOT is trading at $0.7396, down 2.7% over the last 24 hours. Market cap data shows the figure at $1.25B, down 2.69%, even as 24-hour volume has jumped 57.75% to $57.96M.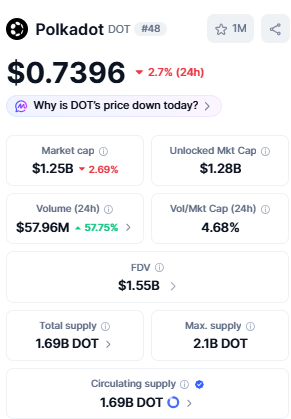
The token carries a $1.55B fully diluted valuation, with 1.69B DOT in circulation out of a 2.1B max supply.
What Are Futures Traders Signalling?
Futures volume is led by Binance at $36.66M, followed by MEXC ($17.61M), WhiteBIT ($15.24M), LBank ($14.11M), and BingX ($13.46M), with OKX, Bybit, Gate, Bitunix, Bitget, KuCoin, Hyperliquid, and Kraken making up the rest.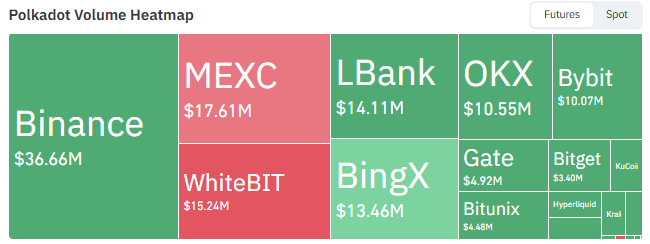
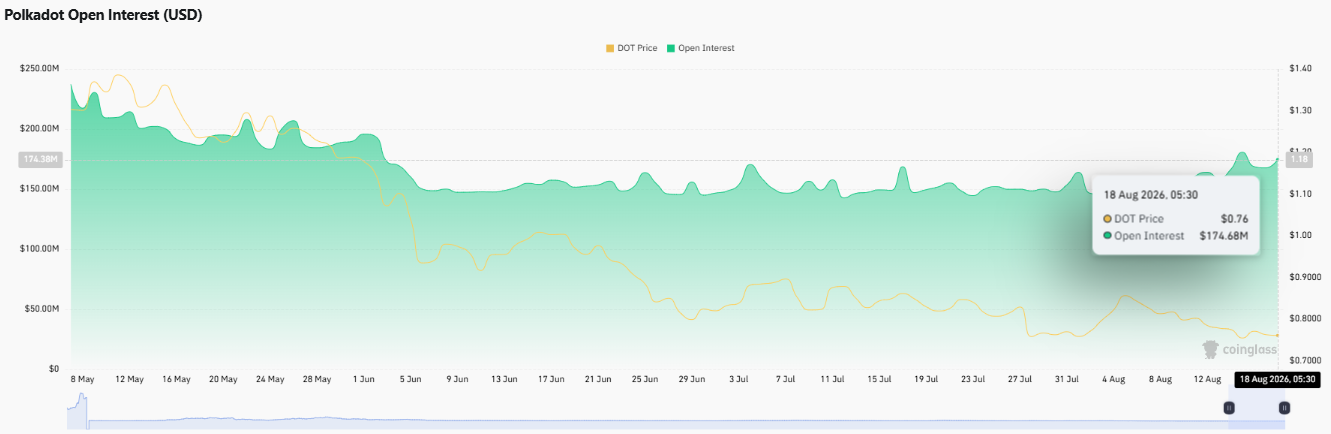
As per Coinglass data, open interest stands at $174.68M as of 18 August 2026, holding within the range it has mostly occupied since June, well off the $200M-plus levels seen back in May.
Positioning leans long across the board despite the falling prices. Binance's account-based long/short ratio sits at 1.666, and OKX runs higher at 2.78.

Binance's top trader accounts show an even stronger 2.1888 ratio, with the position-weighted long/short ratio for top traders at 1.9106, pointing to consistent long positioning even as DOT trends lower.
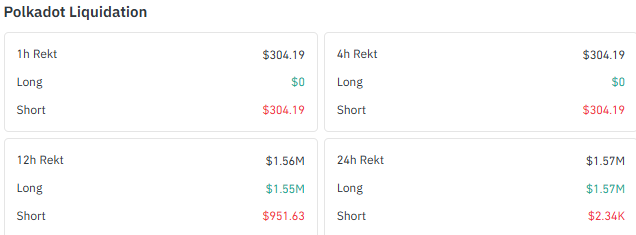
Liquidations over the past day were dominated by longs. Total 24-hour liquidations reached $1.57M, with $1.57M coming from long positions against just $2.34K in shorts, showing leveraged buyers have been on the losing side of this decline.
The 1h and 4h windows, by contrast, were entirely short liquidations, a sign of some short-term volatility in both directions.
Polkadot Technical Analysis: Testing Support Inside the Channel
As per the TradingView daily chart, Polkadot remains locked inside a descending channel that has defined price action since June, and the structure continues to print lower lows with each swing.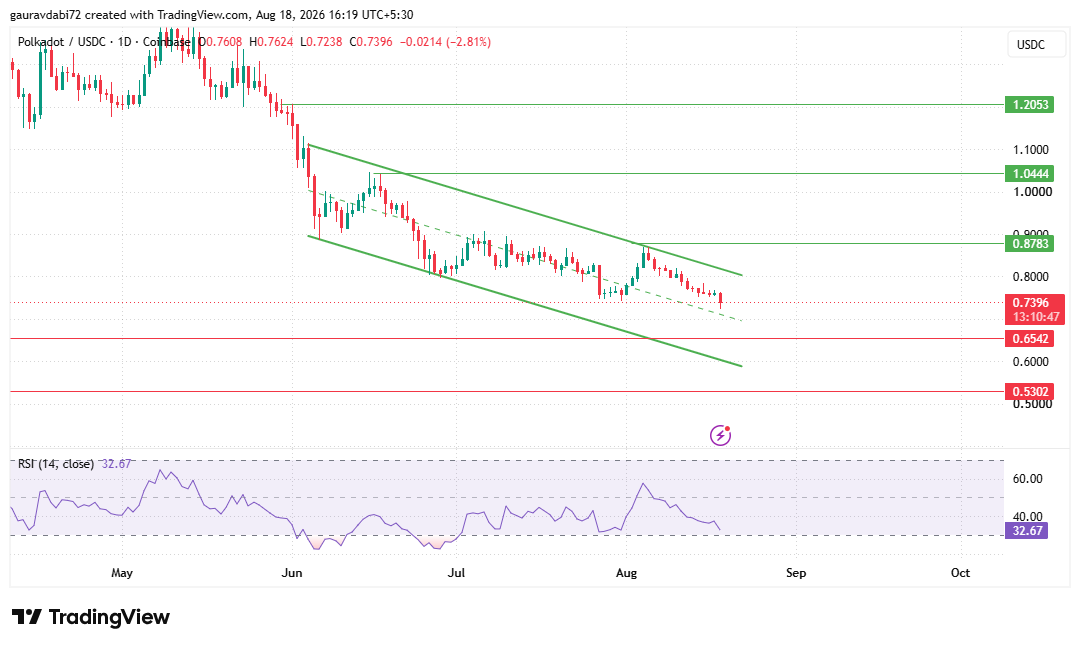
That kind of persistent downtrend keeps sellers in control by default, and the latest leg lower has pushed DOT back toward the lower boundary of the channel.
Polkadot is currently trading near $0.7396, right at the lower boundary of the descending channel. The next real supports below sit at $0.6542 and $0.5302 if this zone gives way.
A break lower from here would extend the pattern of lower lows that has defined this chart for weeks, a continuation flagged in earlier coverage of DOT's recovery prospects.
On the upside, resistance builds at $0.8783, then $1.0444, and $1.2053 further out. These levels sit well above the current channel and would require a decisive break of the descending structure before coming meaningfully into play.
Any near-term bounce would first need to clear the channel's own upper boundary before those zones become realistic, a scenario examined in past coverage of a possible DOT breakout rally.
RSI at 32.67 is the one point working in the bulls' favor. That reading sits inside oversold territory, and moves stretched to the downside sometimes attract short-term buying interest simply on exhaustion.
Whether that turns into a genuine recovery or just a brief pause within the broader downtrend is not something the chart can confirm yet.
If DOT can stabilize around current levels and hold above the channel's lower boundary, a relief bounce becomes possible, though nothing about the current structure guarantees that outcome.
Polkadot Price Prediction: Bull, Neutral and Bear Scenarios
Bullish Case: A stabilization near current levels followed by a break of the descending channel's upper boundary could open the way toward $0.8783, then $1.0444 and $1.2053 further out.
Neutral Case: DOT continues ranging near the channel's lower boundary while the market waits for a clearer signal in either direction.
Bearish Case: A break below the channel's lower boundary would put $0.6542 in focus first, with $0.5302 as the deeper support if selling pressure continues.
How Has DOT Performed Recently?
DOT is roughly flat over the past 4 hours at -0.01% but down 2.63% over 24 hours and 8.07% over the past week.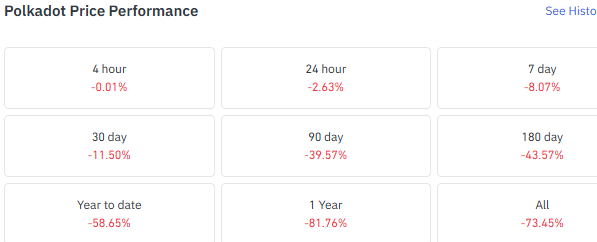
The decline deepens further out, with DOT down 11.50% over 30 days, 39.57% over 90 days, and 43.57% over six months.
Longer term, the token is down 58.65% year to date, 81.76% over the past year, and 73.45% since inception.
Longer-term levels for this move are explored further in August 2026 target-level coverage of DOT, which lines up with the broader downtrend seen across these performance figures.
What We're Watching Next
As per the CoinGabbar analyst, the $0.7400 zone is the clearest line in the sand on DOT's chart right now, and how price behaves here will matter more than any single day's move.
Broader coverage of whether DOT can recover strongly has tracked this same channel for weeks, and the key question remains whether this support holds or gives way to further downside.
Disclaimer: This article is for informational purposes only and should not be considered financial or investment advice. Cryptocurrency markets are highly volatile, and prices can move sharply in either direction. Readers should conduct their own research and consult a qualified financial advisor before making any investment decisions.
0
0


 Manage all your crypto, NFT and DeFi from one place
Securely connect the portfolio you’re using to start.

0
0

0
0


0
0