
Polkadot Price Prediction September 2026: Major Rally Soon?

0
0

$DOT is trending after a post claimed Polkadot surpassed $105M in 24h trading volume, and traders are watching to see if this activity spike turns into a real breakout.
This Polkadot price prediction September 2026 update looks at whether DOT can build on its recent bounce, with $0.9418 as the level that confirms momentum and $0.8283 as the line that would put the setup in doubt.
Market data was checked on August 26, 2026, at 12:10 IST.
Polkadot Price Prediction September 2026 Today: Market Overview
Metric | Value |
Price | $0.8532 |
24h Change | -7.25% |
Market Cap | $1.44B |
Unlocked Market Cap | $1.48B |
FDV | $1.78B |
24h Volume | $97.08M |
Vol/Mkt Cap (24h) | 6.72% |
Total Supply | 1.69B DOT |
Max Supply | 2.1B DOT |
Circulating Supply | 1.69B DOT |
Source: Data from CoinMarketCap as of August 26, 2026, at 12:10 IST. Figures may vary slightly across other tracking websites.
Polkadot News Update: Volume Claim Doing the Rounds
A post from account criptoovar claimed Polkadot surpassed $105M in 24h trading volume, tagging $DOT as one to watch.
Source: Data From X
Note: This figure runs slightly above the $97.08M shown on the market tracker, and CoinGabbar could not independently verify the exact source or timeframe used for the $105M number.
It is best treated as an unverified estimate rather than a confirmed data point until a primary source lines up with it.
Polkadot Liquidation and Volume Data
Futures liquidation data from Coinglass shows the following breakdown.
Window | Total Rekt | Long | Short |
1h | $14.61K | $14.59K | $18.86 |
4h | $16.82K | $15.29K | $1.53K |
12h | $308.90K | $298.04K | $10.86K |
24h | $456.97K | $443.94K | $13.03K |
Longs have taken the bulk of the liquidation damage over the past 24 hours, which lines up with the sharp pullback seen on the daily chart.
Exchange volume is led by Binance at $42.43M, followed by OKX at $14.39M, LBank at $16.18M, BingX at $12.55M, Bybit at $10.33M, MEXC at $7.39M, WhiteBIT at $7.25M, Bitget at $6.81M, Gate at $4.83M, and Bitunix at $4.59M.
This is futures data and is kept separate from the spot volume figure in the market overview above.
Polkadot Price Prediction September 2026 Analysis: Chart Levels
Pair: DOT/USDT · Market: Spot (Crypto) · Exchange: OKX · Timeframe: 1D · Source: TradingView · Timestamp: August 26, 2026, 11:05 UTC+5:30
DOT is trading at $0.8532, after a sharp spike briefly pushed the price toward $1.0376 before it pulled back into the $0.8283 to $0.9418 zone.
The move broke the descending channel DOT had been sliding in since June, though price has since cooled off and is now consolidating just above the EMA cluster.
Let’s see whether this is just a pullback or if the price is heading back into the previous channel range, which will be an important setup to watch for September.
RSI (14) sits at 53.53, a neutral-to-firm reading that shows the recent bounce hasn't stretched into overbought territory yet.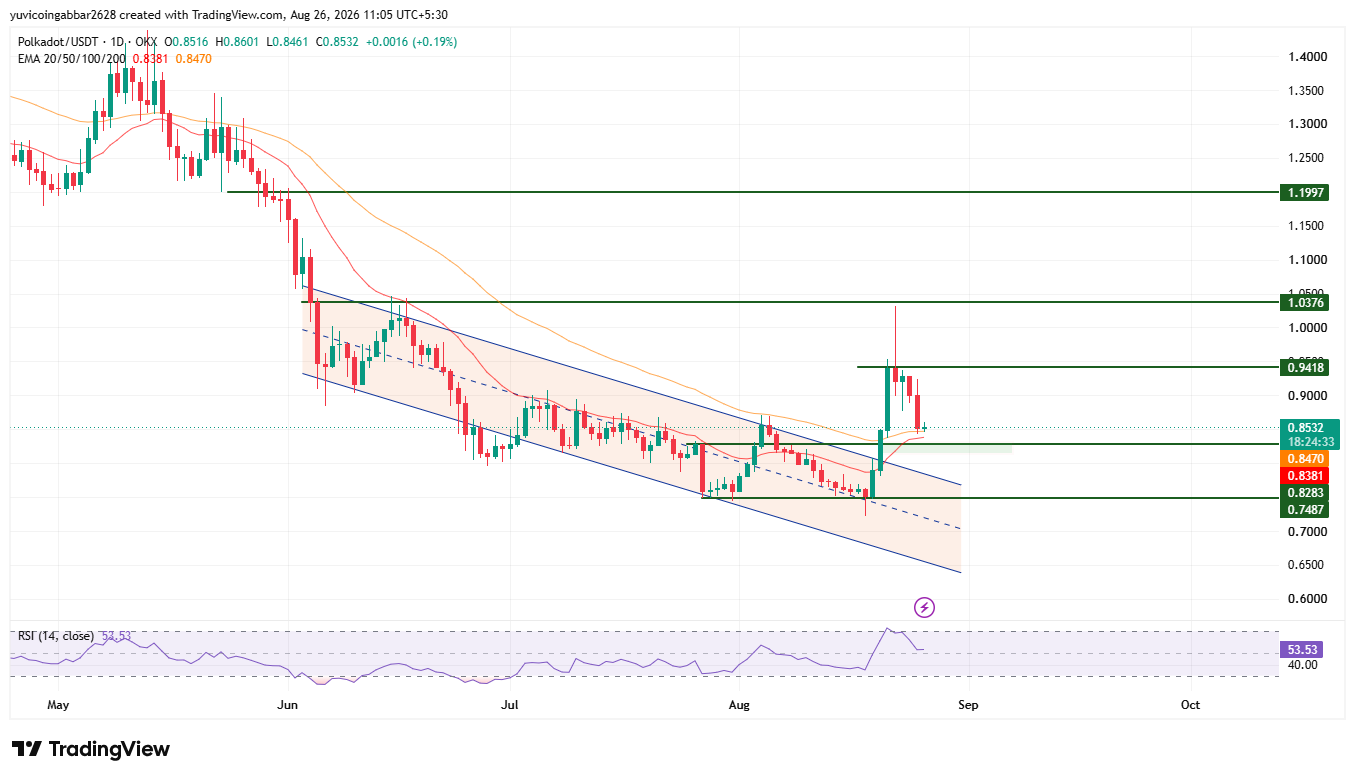
Polkadot Price Prediction September 2026: key Levels
Level Type | Price |
Resistance 3 | $1.1997 |
Resistance 2 | $1.0376 |
Resistance 1 (nearest) | $0.9418 |
Immediate Price Reference | $0.8532 |
First Confirmed Support | $0.8283 |
Deeper Support | $0.7487 |
Polkadot Price Prediction September 2026: Bull, Base and Bear Cases
Bull case: Holding above the EMA cluster near $0.8381 to $0.8470 and clearing $0.9418 would confirm the spike wasn't a one-off, opening room toward $1.0376 and eventually $1.1997.
Base case: DOT keeps chopping between $0.8283 and $0.9418 for now, digesting the recent spike before committing to a clear direction either way.
Bear case: A close back below $0.8283 would undo the recent bounce and suggest the spike was driven by short-term positioning rather than a real trend shift, with $0.7487 as the next level to watch.
Scenario | Trigger | Likely Outcome | Invalidation Point |
Bullish continuation | Close above $0.9418 | Move toward $1.0376 | Close back below $0.8532 |
Range-bound | Price stays $0.8283-$0.9418 | Sideways consolidation | Break of either boundary |
Bearish breakdown | Close below $0.8283 | Drop toward $0.7487 | Reclaim of $0.8283 |
Can DOT Reach $1.1997?
$1.1997 is the highest resistance marked on the chart.
Reaching it would require DOT to clear $0.9418 first, then break and hold above $1.0376, a multi-stage move rather than a single leg higher.
Polkadot Price Prediction September 2026: Expert View
According to CoinGabbar analysts, the volume spike and sharp bounce show real buying interest returned to DOT, but the pullback from $1.0376 and the heavy long liquidations over the past day suggest leveraged traders got caught offside.
The $0.8283 to $0.9418 zone is the key battleground: holding it keeps the recovery thesis alive, while losing it points back toward the prior downtrend.
Disclaimer: This piece is for informational purposes only and isn't financial advice. The levels and scenarios above are based on technical chart analysis and publicly available data at the time of writing, and crypto markets can move sharply within hours. It's worth doing independent research and considering your own risk tolerance before acting on any of the levels discussed here.
0
0


 Manage all your crypto, NFT and DeFi from one place
Securely connect the portfolio you’re using to start.


