
Stellar Price Prediction: Can XLM Break Resistance?

0
0

Stellar's validator lineup just got a credibility boost, but the chart hasn't gotten the memo yet.
This Stellar price prediction looks at what Range's new Tier 1 validator status actually means for the network,
And why price is still stuck fighting a resistance zone it hasn't been able to clear in weeks.
What Does Range's Tier 1 Validator Status Mean for Stellar?
Range, the infrastructure firm that secures stablecoin and fiat rails for institutional clients, has stepped up to become a Tier 1 validator on Stellar.
CEO Andres Monteoliva framed it as a natural extension of work the company already does daily, telling followers that institutions settling real money on the network deserve to know the organizations underpinning it have direct skin in the game.
The distinction matters more than it might sound. A Tier 1 validator carries greater responsibility inside Stellar's consensus process,
And having a firm whose entire business is built around protecting stablecoin and fiat flows take on that role is a different signal than a generic node operator joining the set.
It tells institutional users that the parties validating transactions have a vested interest in getting security right, not just a technical checkbox.
For investors, the honest read is that this strengthens Stellar's case as settlement infrastructure without doing anything to XLM's supply or demand balance.
Validator additions don't create buy pressure, and traders looking for a price reaction tied directly to this announcement are likely to be waiting a while.
What it does is add another data point to the argument that serious infrastructure players keep choosing Stellar, which matters far more over a multi-year horizon than over the next trading session.
What Is the Daily Chart Showing for Stellar?
Zoomed out, $XLM is still working through the aftermath of a sharp summer spike that pushed price above $0.28 before sellers took over.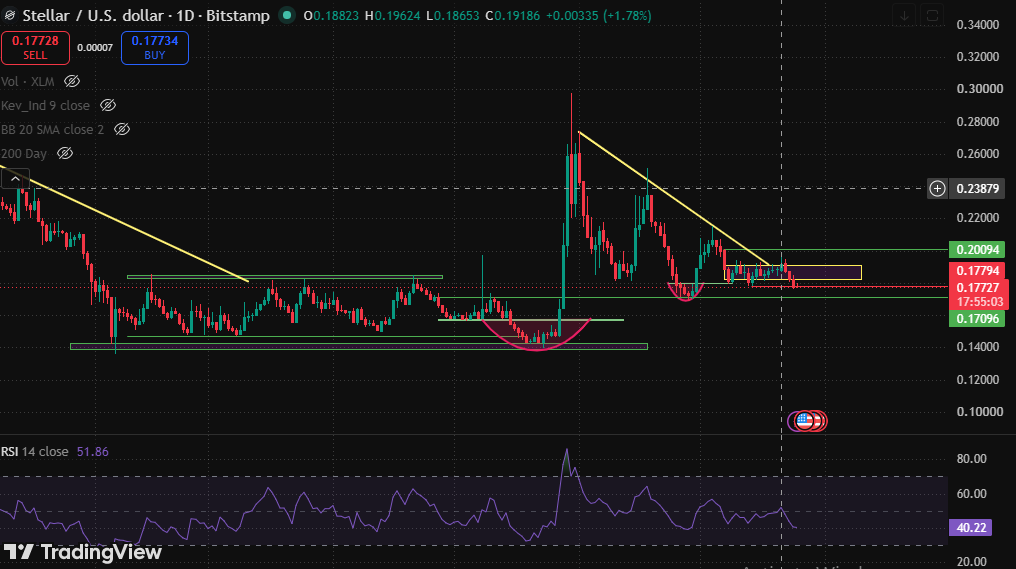
Since then, a descending trendline has capped every recovery attempt, and price has spent recent weeks compressing beneath it in a shallow rounding pattern rather than breaking free.
Resistance on this timeframe sits at $0.20094, a level price hasn't traded above during the entire pullback.
Support has formed closer to $0.17096, an area buyers have defended on multiple tests.
Daily RSI reads 40.22, sitting below the midline without being deeply oversold, a reading more consistent with a market still searching for direction than one signaling an imminent turn.
How Is Stellar Trading on the 4-Hour Chart?
Drop down to the 4-hour view and a different story shows up.
Price recently broke out of a descending triangle to the downside, and the bounce attempts since have been shallow and quick to fade, with sellers reasserting control near $0.18137 each time buyers tried to push higher.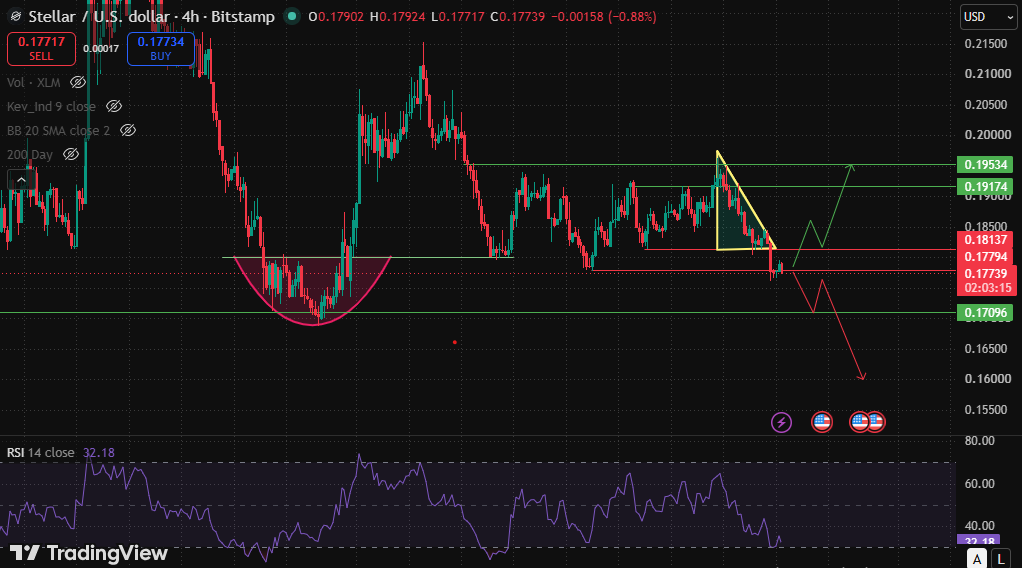
Short-term RSI has fallen to 32.18, well into oversold territory and notably weaker than the daily reading.
That gap between timeframes suggests the selling pressure is concentrated in the immediate term rather than reflecting a broader structural breakdown.
Which raises the odds of at least a short-lived bounce even if the larger trend stays undecided.
What Are Stellar's Derivatives Metrics Signaling?
Funding sits slightly negative at -0.0033%, a mild lean toward bears rather than anything approaching an aggressive short squeeze setup.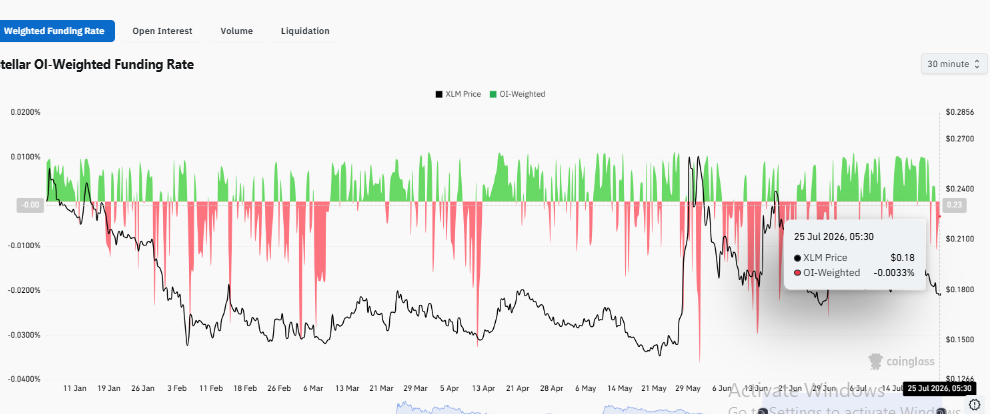
Open interest is still elevated compared to the lows seen earlier this year, which tells you a fair amount of leverage hasn't left the market yet.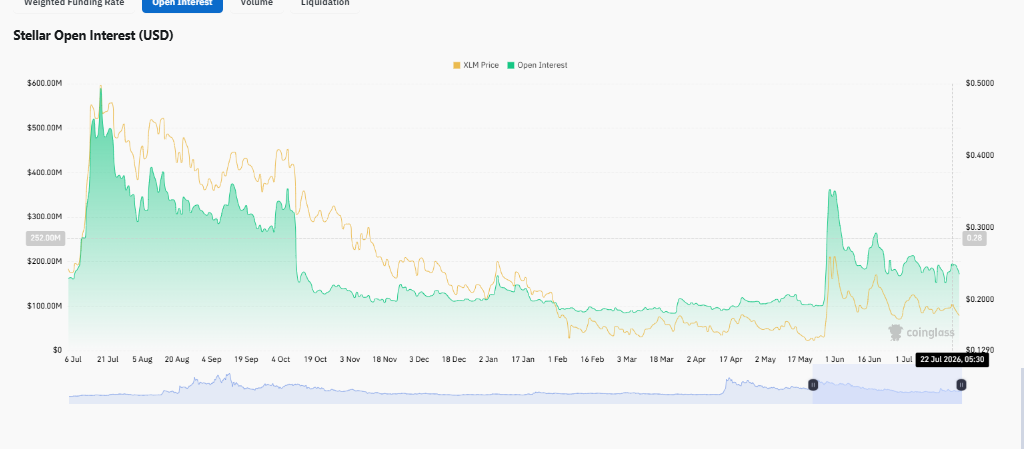
Exchange positioning doesn't point in one clean direction. Binance's retail accounts show a long/short ratio of 0.8818, tilted toward shorts, while OKX traders lean the other way at 1.73. Binance's top traders, both by account count and position size, are sitting modestly long too.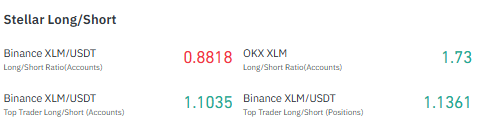
Put together, that's professional money looking a bit more confident than the retail crowd, though it's not the kind of gap that confirms a broader turn just yet.
Liquidations make it obvious where the recent pain landed.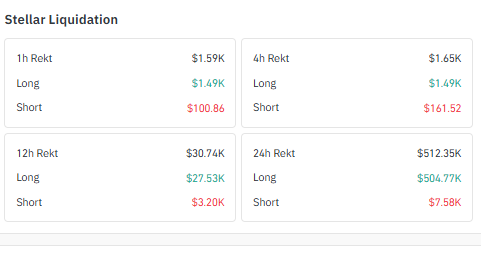
Longs took $504.77K in liquidations over the past 24 hours against a mere $7.58K for shorts, so leveraged buyers clearly bore the brunt of the latest drop.
Most of the trading volume is still running through Binance, with MEXC and Bybit next in line, and smaller pockets of liquidity spread across OKX, Bitget, and BingX.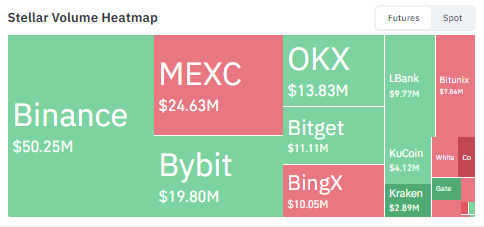
Source: Stellar data on CoinGlass as of July 25, 2026. Figures may vary slightly across other tracking websites
How Has Stellar Performed Across Timeframes?
Short-term price action has been rough. $XLM sits 0.92% lower over four hours, 3.93% down on the day, and off 4.45% for the week, with the 30-day figure at negative 4.34%.
Zoom out to 90 days and the picture changes: $XLM is still up 4.42% over that stretch, a sign the current dip is eating into earlier gains rather than marking the continuation of some long grinding slide. The 180-day and year-to-date numbers tell a harder story, down 12.69% and 11.66% respectively, and that's the weight still hanging over broader sentiment.
Stellar (XLM) Price Prediction: What Happens Next?
As per CoinGabbar's analysis, buyers get a stronger case only if $XLM reclaims $0.18137 and holds it, with $0.19174 as the next test and $0.19534 waiting beyond that. A clean push through the daily resistance at $0.20094 would be the first real evidence that the broader trend is turning, not just a short-term bounce.
The other side of that trade shows up if $0.17096 gives way. Losing that level would crack the base that's held for weeks and open a path toward deeper support further down.
There's also a good chance neither happens right away. If $XLM keeps churning between $0.17096 and $0.18137, that's the market telling you buyers and sellers haven't resolved anything yet, and the range holds until something forces a real breakout.
Conclusion
Range stepping up as a Tier 1 validator says something real about Stellar's institutional credibility, but infrastructure news like this rarely shows up in price the same week it's announced. Right now the chart is doing the talking. Clear resistance and the bulls have a real case; lose support and the weakness gets reinforced. Until one of those happens, patience and disciplined risk management probably matter more than trying to call the exact bottom.
Disclaimer: This article is for informational and educational purposes only and should not be considered financial or investment advice. Cryptocurrency markets are highly volatile, and prices can change rapidly. Readers should conduct their own research (DYOR) and consult a qualified financial advisor before making any investment decisions. The views expressed in this article are based on publicly available information and technical analysis at the time of writing.
0
0


 Manage all your crypto, NFT and DeFi from one place
Securely connect the portfolio you’re using to start.

0
0

0
0

0
0

0
0