
Ethereum (ETH) to USDT chart on a 1 day time frame on 10.09.2022.

0
0
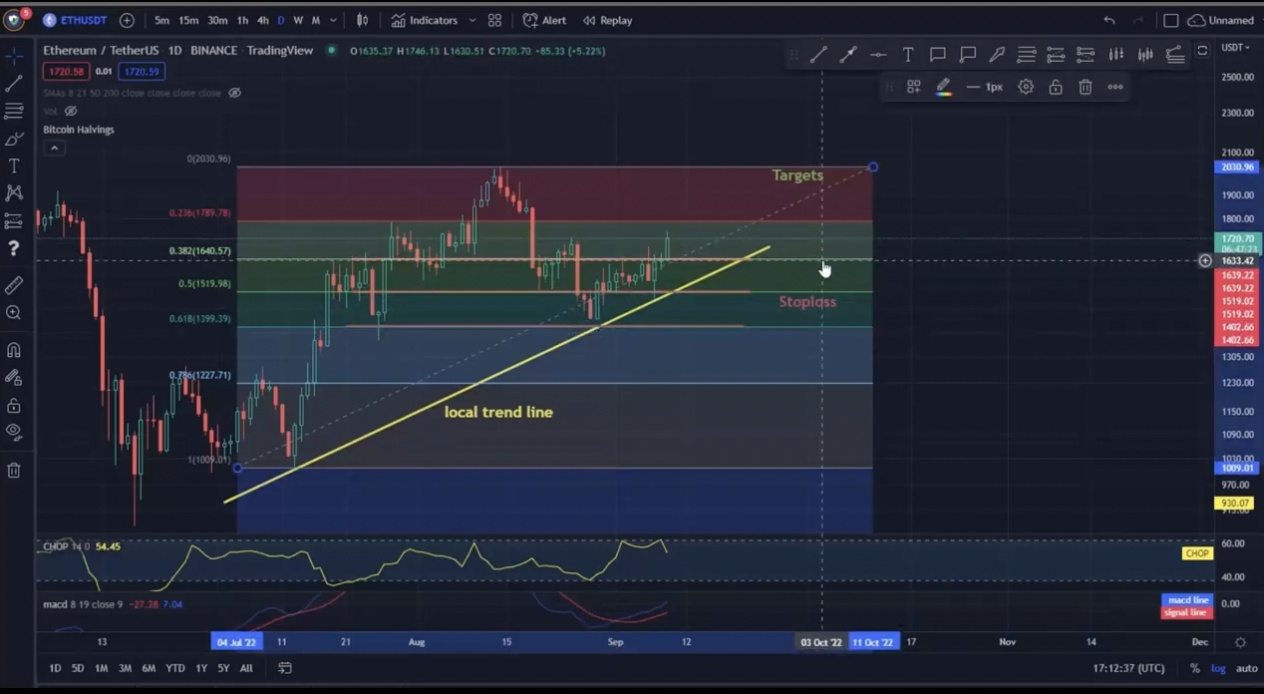
Hello everyone, let's take a look at the ETH to USDT chart on a 1 day time frame on 09.09.2022. As you can see, price is moving above the local uptrend line.
Let's start with the designation of the support line and as you can see the first support in the near future is $ 1639, if the support breaks down, the next support is $ 1519 and $ 1402.
Now let's move from the resistance line as you can see the first resistance is $ 1728, if you can break it the next resistance will be $ 1800, $ 1898 and $ 2034.
Looking at the CHOP indicator, we can see that some energy has been used in the 1 day interval, but we have a lot to continue moving, and the MACD indicator shows an uptrend.
Disclaimer: Technical Analysis is provided by a third party, and for informational purposes only. It does not reflect the views of Crypto Daily, nor is it intended to be used as legal, tax, investment, or financial advice.
0
0


 Управляйте всей своей криптовалютой, NFT и DeFi из одного места
Безопасно подключите используемый вами портфель для начала.


