
Chunkee Price Prediction: Can Bulls Hold $0.013 After Listings?

0
0

Can a token that traded near $0.00055 on Nov 16 hold $0.013 after CoinGecko and Dexscreener listings and a 267% day?
That question sits at the center of every Chunkee price prediction today, and crypto price predictions built on levels beat hype.
Bulls own the trend. In the short term, though, the chart wants a pullback first.
Chunkee Price Prediction Today and Market Snapshot
Chunkee is an Ethereum meme token with a 1B supply, all of it circulating. CoinGecko ranks it 929th, and memecoin market news tracks similar launches.
The price is $0.01323, up 267.3% in 24 hours. The 24H range runs from $0.003766 to $0.01577, which is also the all-time high.
At 04:27 UTC on Nov 20, the hourly pool chart shows $0.01335.
Volume and Market Cap
Trading volume, the amount traded in 24 hours, is $1.667M against a $14.415M market cap. CoinGecko's price page tracks the same candles.
Pool data shows 593 buys against 242 sells. But liquidity, the money backing trades, is thin at about $303K.
Why Is Chunkee Up Today After the Listings?
The price ran from $0.003766 to $0.01577. Volume exploded on Nov 20.
Listings pulled buyers in. CoinGecko and Dexscreener both added the token within two days, and recent exchange listings show how fast attention follows.
What the X Posts Show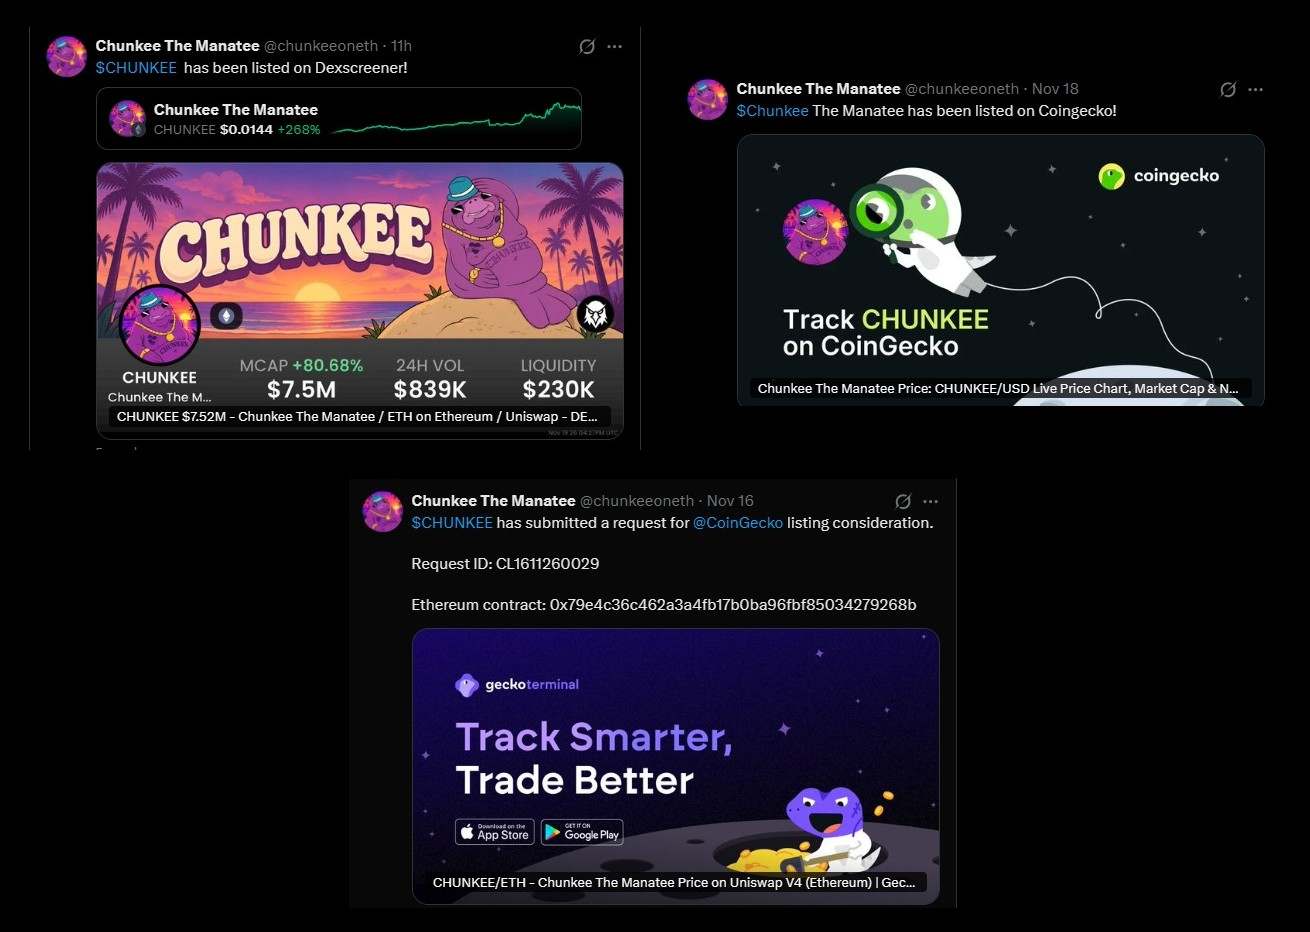
On the project's X account, 3 updates matter. The first, 4 days before the 04:27 UTC chart timestamp on Nov 20, said a CoinGecko listing request was filed.
Next came the CoinGecko listing post, 2 days before the timestamp, matching the first push off the lows on Nov 18.
The newest is the Dexscreener listing post, 11 hours old in the screenshot. None of the posts add a product or a roadmap.
Chunkee Technical Analysis From Launch to Now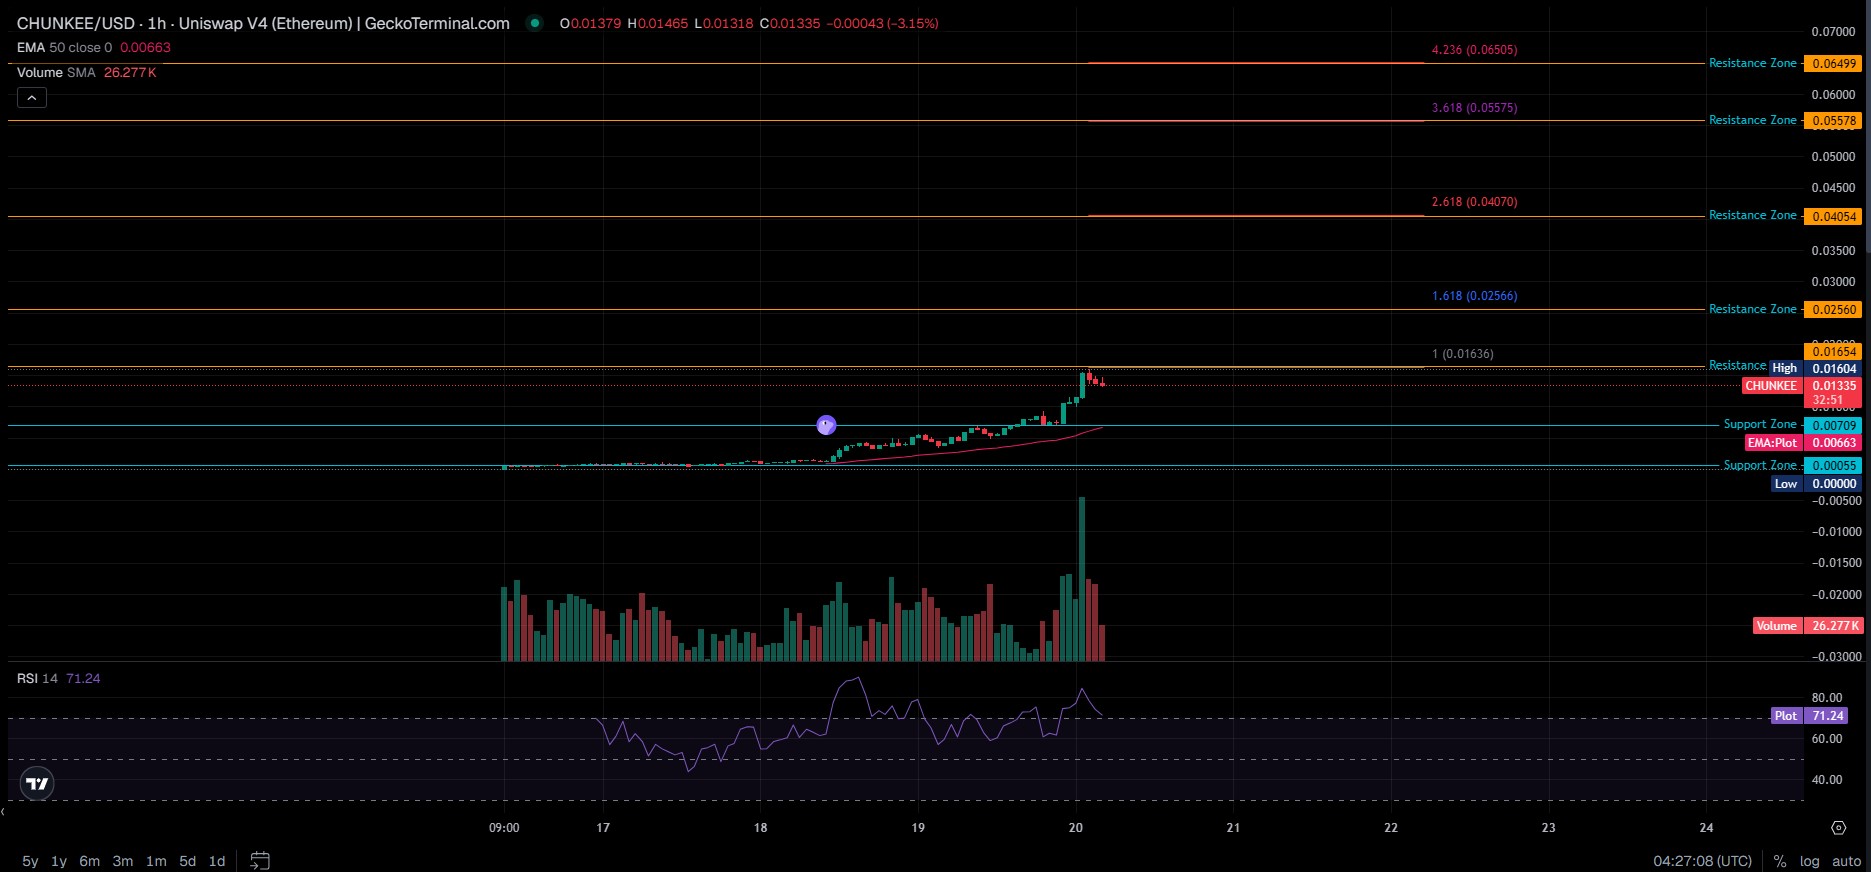
Chunkee technical analysis starts on Nov 16.
Hourly Chart Walkthrough
The hourly GeckoTerminal chart opens flat. Price sat near the $0.00055 support zone, a level where buyers step in, and volume stayed small and even.
Dead flat until Nov 18, and then candles grew, the price cleared the 50-period EMA, an exponential moving average of the last 50 hourly prices, and RSI hit about 90. Price then crawled to the $0.00709 zone on Nov 19.
On Nov 20, a single candle carried the tallest volume bar and hit $0.01604, just under the $0.01654 resistance zone, where sellers cap price. And RSI jumped past 80.
3 red candles followed. The latest traded between $0.01318 and $0.01465 and sits at $0.01335 at 04:27 UTC.
Volume faded after the spike. That's a 16.8% pullback from $0.01604, and the price still sits 101% above the $0.00663 EMA.
This Chunkee price prediction treats $0.01318 as the line that matters.
RSI and Exponential Moving Average
RSI 14 measures buying strength from 0 to 100, and readings over 70 mean overbought. It stands at 71.24, down from about 85 at the spike.
Is that a reason to sell?
The 50 EMA sits at $0.00663, 49.9% under price. That sounds bearish. On second thought, it isn't, because the EMA keeps rising.
Holder Data and Wallet Behavior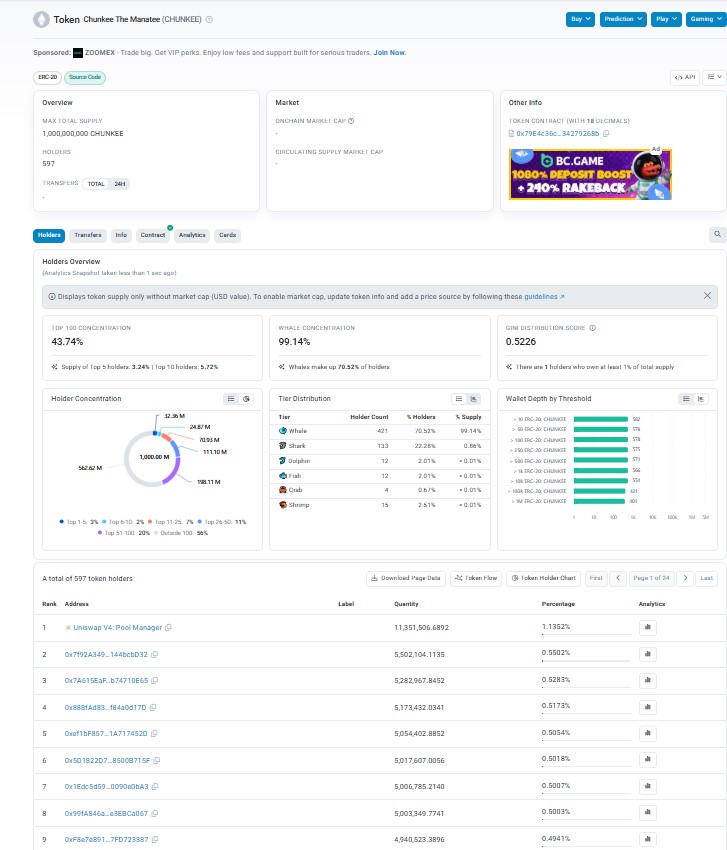
Etherscan holder data lists 597 holders, and the top 100 wallets hold 43.74%.
Early buyers paid $0.000518 to $0.0007478 a token. Paper gains, meaning unrealized profit, run from 1,347% to 2,513%, and 4 of the 9 top wallets haven't sold.
That much profit invites selling into every bounce. Five of those nine wallets had already sold once.
Key Levels to Watch
Support Levels
Support starts at $0.01318, the low of the latest candle. Below it sits the key support zone at $0.00709, with the 50 EMA just below at $0.00663.
A trade below both ends the bullish read.
Resistance Levels
Resistance, the other half of support and resistance, starts at $0.01465, the latest hourly high. Next comes $0.01577, the all-time high, then $0.01654, 25% above $0.01323.
But a break above $0.01654 matters for a simple reason. Nothing sits overhead until $0.02560.
Fibonacci extension zones, levels drawn from the size of the prior move, sit at $0.02560, $0.04054, $0.05578 and $0.06499.
Chunkee Price Forecast and Scenarios
This Chunkee price forecast uses 3 paths built on chart levels.
Bulls need a break above $0.01654 on rising volume. That opens at $0.02560, a price target 93.5% above $0.01323, then $0.04054 at a $40.5M market cap.
And in this Chunkee price prediction, the base path gets the edge for the next 24 hours, with price chopping between $0.01318 and $0.01654.
Bears need a breakdown under $0.01318 on heavy sell volume. That opens $0.00709, 46.4% below $0.01323.
Scenario | Trigger | Target | Invalidation | Liquidity Condition |
Bull | Break above $0.01654 on high volume | $0.02560, then $0.04054 | Trading below $0.01318 | Pool depth grows past $303K |
Base | Range between $0.01318 and $0.01654 | $0.01318 to $0.01654 | Break of either level on volume | Volume near the 26.277K average |
Bear | Breakdown under $0.01318 | $0.00709, then $0.00663 | Reclaim of $0.01654 | Sells outnumber buys |
Chunkee Price Outlook Beyond This Week
A Chunkee price outlook past 7 days depends on liquidity more than on the chart. $0.04054 needs nearly 2.8 times today's market cap.
A meme token this size often gives back a large share of a spike, and meme coin news tracks which launches are held.
Early wallets already hold big gains, so a Chunkee price projection above $0.02560 needs fresh buyers.
Risks That Change the Chunkee Price Prediction
Liquidity is about $303K, and a single large sale moves the price fast.
This Chunkee price analysis uses CoinGecko, GeckoTerminal, and Etherscan screens, with the chart stamped 04:27 UTC on Nov 20. Crypto news updates can change the setup fast.
Where Chunkee Stands Now
Bulls hold the trend above $0.00709, but the next 24 hours favor a pullback toward $0.01318. A break of $0.01654 changes that. Thin liquidity makes a new exchange listing the first real test.
Disclaimer: This article is for information only and isn't financial advice. Crypto prices swing fast, and a small token can lose most of its value in hours. Readers should research the project and decide for themselves before trading.
0
0
 Manage all your crypto, NFT and DeFi from one place
Securely connect the portfolio you’re using to start.