
FOMC in 6 Days: Will Bitcoin, Ethereum, and XRP Prices Rise or Fall?

0
0

The FOMC meets on October 28, and crypto traders are watching closely. Bitcoin, Ethereum, and XRP all slipped between 1% and 1.5% on their latest daily candles.
All three coins are stuck below key resistance levels. Here is what the charts and rate odds show.
What Are the Odds of a Fed Rate Hike on October 28?
CME futures data from October 21 shows an 84.5% chance the Fed holds rates at 3.75% to 4.00%. A hike to 4.00% to 4.25% sits at 15.5%. Easing is priced at 0%.
The mood changed fast. A month ago, traders priced a hike at 57.6%.
Outcome | Now (Oct 21) | 1 Week Ago | 1 Month Ago |
No change (3.75% to 4.00%) | 84.5% | 66.8% | 42.4% |
Hike (4.00% to 4.25%) | 15.5% | 33.2% | 57.6% |
Cut | 0% | 0% | 0% |
A hold is now the clear base case. A surprise could move prices in either direction.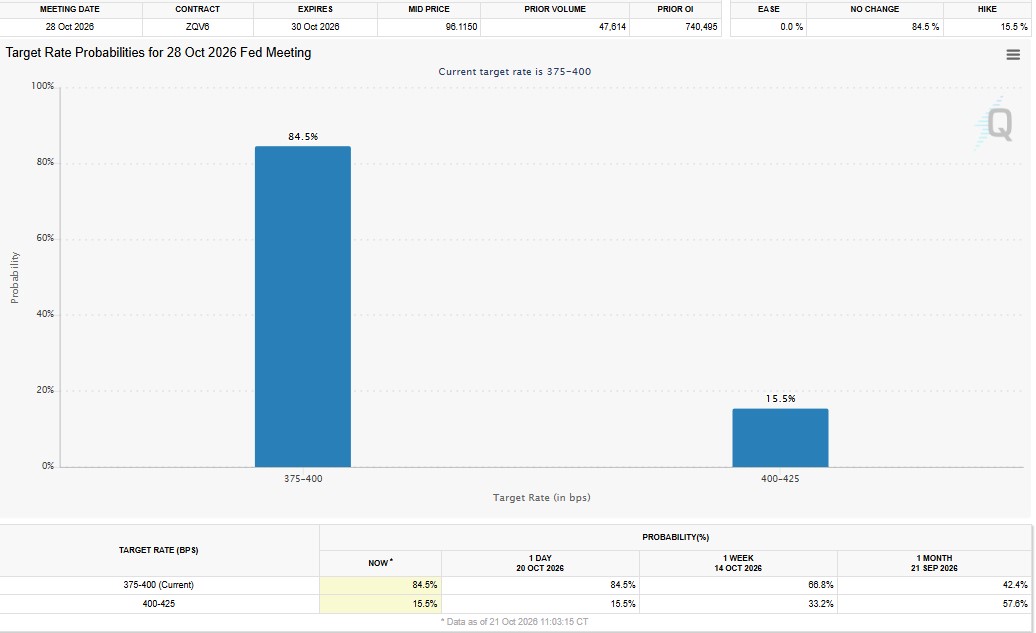
Bitcoin Price Prediction: Will BTC Break Above $87,404?
Bitcoin is hovering near $82,808, down 1.45%. The daily range was $82,598 to $84,294.
BTC trades inside a falling channel that began in late September. The top line sits near $84,000. The bottom is near $80,000.
The main ceiling is $87,404. Price touched that area in September and got turned away.
RSI is at 51.37, which is neutral. Neither buyers nor sellers are in control.
A daily close above $84,000 would be a first sign of strength. A drop below $80,000 could open the way toward $75,000, where an older channel found its lows.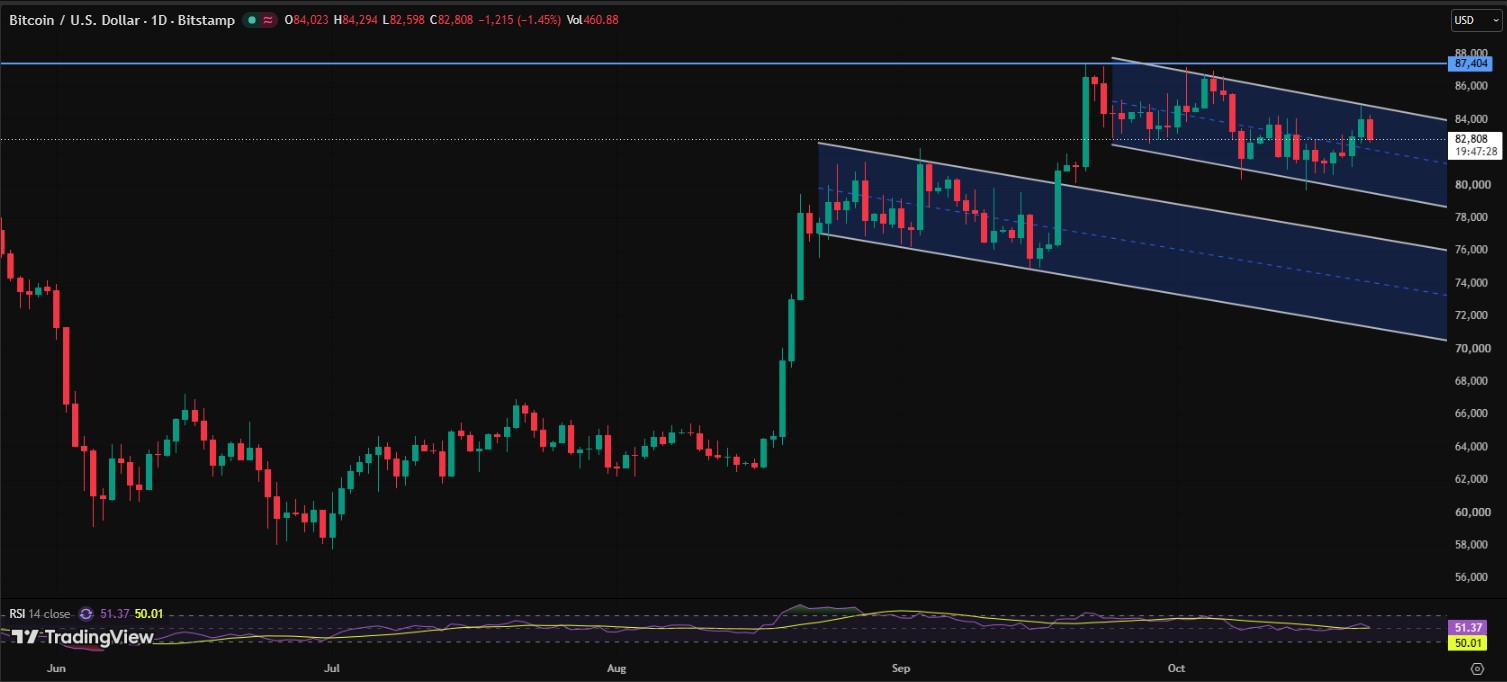
Ethereum Price Prediction: Can ETH Hold the $2,350 Support?
Ethereum is trading at $2,444.58, down 1.18%. It peaked near $2,800 in late September and has slid since then.
Resistance sits at $2,541.63. Price was rejected there again this week.
Support is a zone near $2,350. Buyers defended it several times. A rising trendline from the June low near $1,520 runs just below it.
RSI is 43.17, under the 50 mark. Momentum is soft.
A break below both the zone and the trendline would weaken the structure. A move above $2,541.63 would be the first real test for bulls.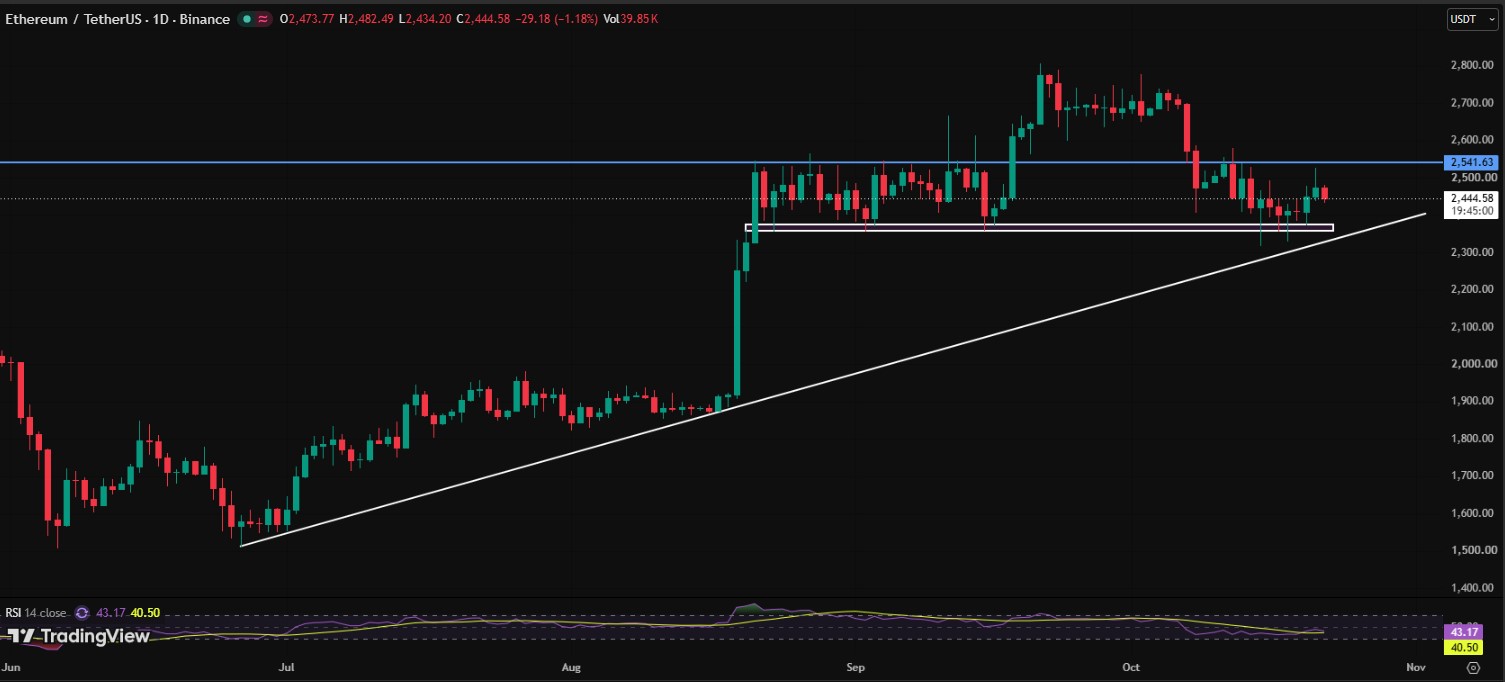
XRP Price Prediction: Will XRP Break Out of the Falling Channel?
At the time of writing, XRP is trading at $1.3464, down 1.39%. It is pressing against the upper line of a falling channel, near $1.37.
The channel started after a high near $1.66 in September. Recent lows around $1.26 to $1.30 act as support.
If XRP closes above the line, the next level is $1.48. That price worked as a pivot several times in recent months.
RSI reads 44.75. It is not oversold, but it is not strong either.
A rejection here could send XRP back toward $1.30 and the channel floor.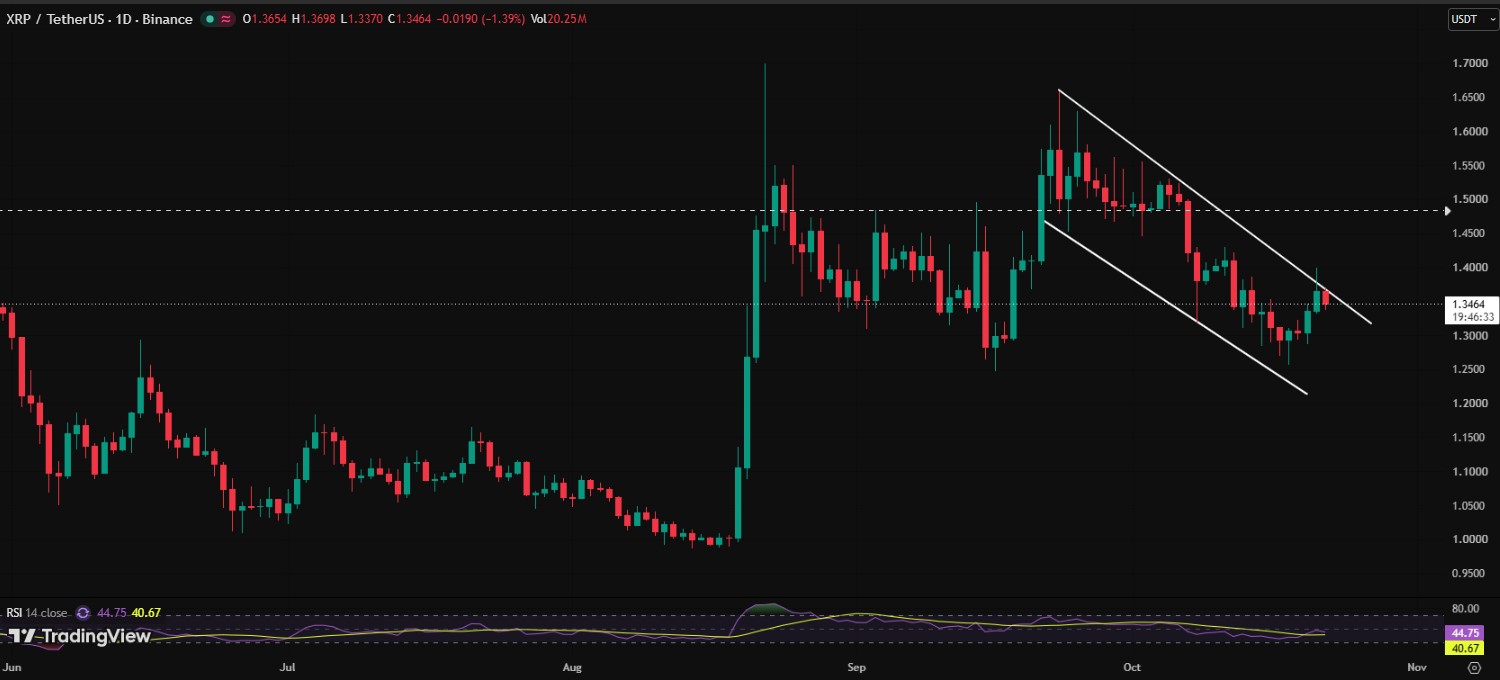
Key Price Levels for Bitcoin, Ethereum, and XRP
| Coin | Latest Price | Resistance | Support | RSI (14) |
| Bitcoin (BTC) | $82,808 | $84,000 / $87,404 | $80,000 / $75,000 | 51.37 |
| Ethereum (ETH) | $2,444.58 | $2,541.63 | $2,350 | 43.17 |
| XRP | $1.3464 | $1.37 / $1.48 | $1.30 / $1.26 | 44.75 |
Will Crypto Rise or Fall After the FOMC Decision?
Nobody can say for sure. A hold is the base case, so the headline itself may not move prices much. The tone of the Fed's statement could matter more.
A firm message on inflation may pressure risk assets. A softer message may help them. Quick spikes and fake moves are common around the release.
All three charts sit at decision points. Many traders may wait for a daily close beyond the levels in the table before the FOMC outcome is clear.
Disclaimer
This article is for information only. It is not financial, investment, or trading advice. Crypto prices are very volatile, and you can lose money. Past performance does not guarantee future results. Do your own research and speak with a licensed financial advisor before making any decision.
0
0


 Manage all your crypto, NFT and DeFi from one place
Securely connect the portfolio you’re using to start.
 Where will Bitcoin trade next?
Live Polymarket and Kalshi odds on Bitcoin price targets, compared side by side.
See Bitcoin price odds


